Glass recycling – Current market trends
 Credit/Quelle: Svensk Glasåtervinning
 Credit/Quelle: Der Grüne Punkt / Peter Liedtke
 Credit/Quelle: European Environment Agency
 Credit/Quelle: Glass Alliance Europe
 Credit/Quelle: Glass Alliance Europe
 Credit/Quelle: FERVER
 Credit/Quelle: FEVE
 Credit/Quelle: GPI
 Credit/Quelle: Svensk Glasåtervinning
 Credit/Quelle: AGVU
 Credit/Quelle: AGVU
![11 Container glass recycling rates in Italy [2]](https://www.recovery-worldwide.com/imgs/1/3/5/9/6/3/0/11_Harder-3f074fb5c9b7351f.jpeg)
![12 Differences in glass recycling in Italy‘s regions [2]](https://www.recovery-worldwide.com/imgs/1/3/5/9/6/3/0/12_Bild12_Italy_RegionalData-2498a19374626995.jpeg)
 Credit/Quelle: OneStone Research
 Credit/Quelle: Vetropack
 Credit/Quelle: Verallia Deutschland AG
 Credit/Quelle: Verallia Deutschland AG
 Credit/Quelle: BDVE
 Credit/Quelle: Binder+Co
 Credit/Quelle: BT-Wolfgang Binder GmbH
 Credit/Quelle: Austria Glas Recycling
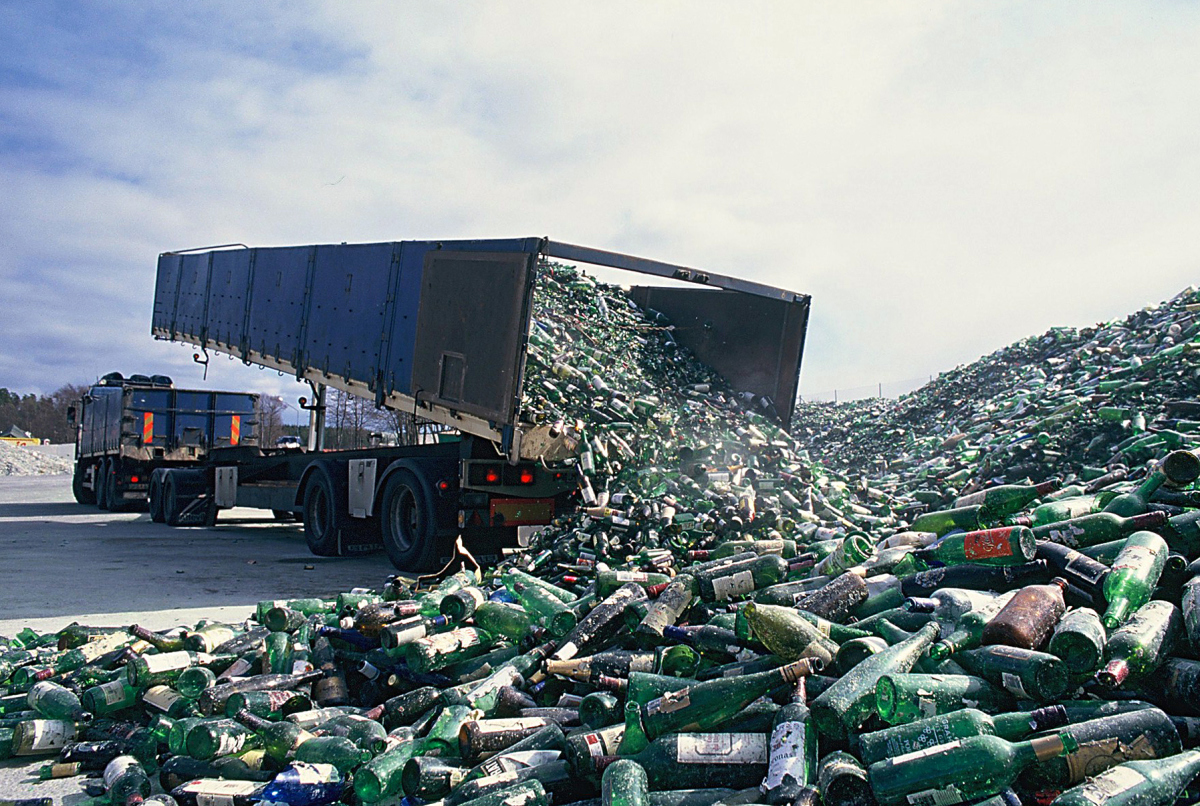
Depending on the degree of purity achieved in the processing of cullets from waste glass recycling, glass can be melted as often as desired and converted into new products. As is the case with many other recycling industries, Europe is also a leader in this sector. However, there are also deficits. The following report provides current data and trends.
1 Introduction
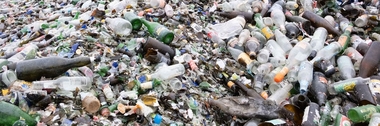
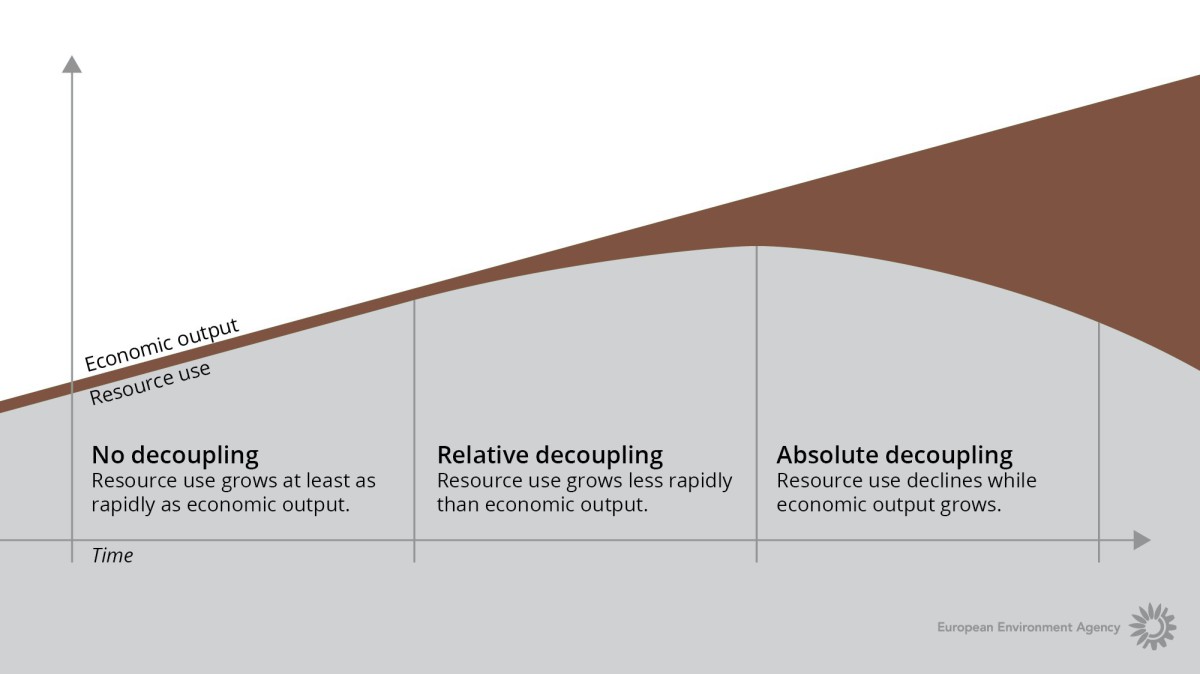
In view of increasing populations and rising incomes, the decoupling of economic growth and production from resource consumption is becoming increasingly important (Fig. 1). Glass is an example of a resource that has unlimited recycling potential and can be recycled with virtually no loss of quality. However, given the large global production quantity and the great differences in recycling rates per region and per glass application sector, the decoupling of production volumes and resource consumption is still a long way off. Only in the case of container glass are recycling rates of above 90 % achieved in some countries today. However, on a global scale, this only amounts to a recycling rate of less than 35 %.
Worldwide, around 130 million tonnes (Mta) of glass are currently produced annually. The largest volumes of 63 Mta or 48 % are accounted for by hollow or container glass, 54 Mta or 42 % are accounted for by the various flat glass products (construction and window glass, car glass, etc.), 5 % are accounted for by tableware and 6 % by all other glass products. Over 1350 glassworks with over 2500 glass furnaces are in operation today. Global glass production capacities exceed 195 Mta, of which 44 % are for flat glass and 46 % are for container glass. Global recycling volumes are currently estimated to be around 27 Mta, which represents only 21 % of the amount of glass produced. The highest recycling rates are achieved for container glass, with an estimated 32 %, while the recycling rate for flat glass is only 11 %.
2 Regional developments
2.1 Europe
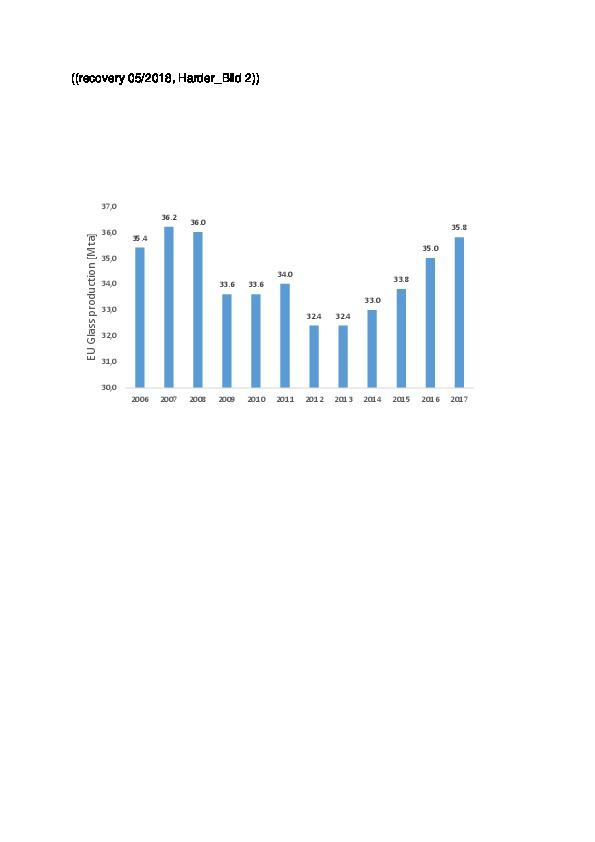
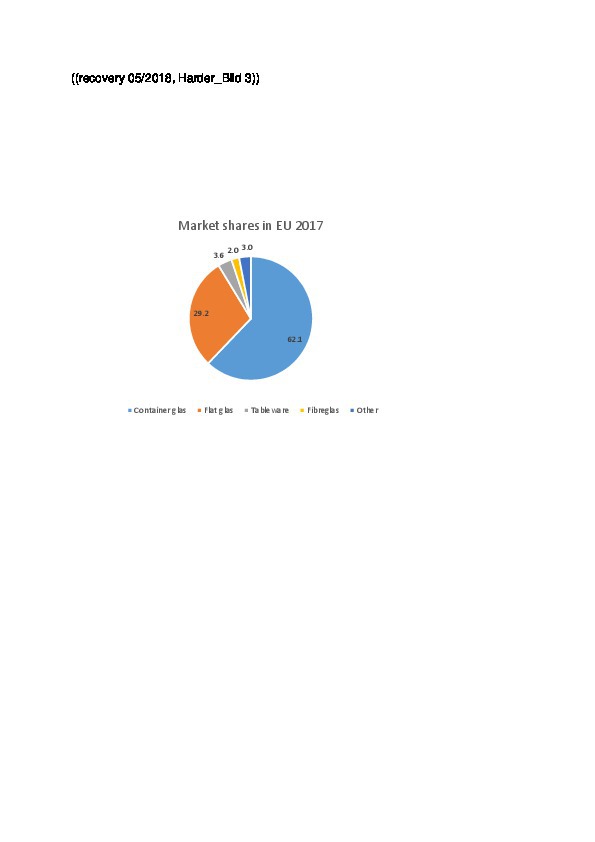
The best statistical data on glass recycling can be obtained in Europe. Fig. 2 shows the development of glass production in the EU in recent years. Production quantities declined sharply in 2009 due to the global economic crisis and the sharp slump in the construction sector, reaching a low point by 2013. Since then, noticeable growth has again been achieved. At present, the EU glass industry has a production volume of 35.8 Mta, which is at about the same level as before the economic crisis, accounting for 28 % of global production. In Fig. 3, the 2017 glass production volumes in the EU-28 are broken down into the various glass types. Container glass accounts for a market share of 62.1 % and flat glass for 29.2 %. All other glass types together amount to 8.7 %. Of the 35.8 Mta, 3.2 Mta are exported and 4.0 Mta imported.
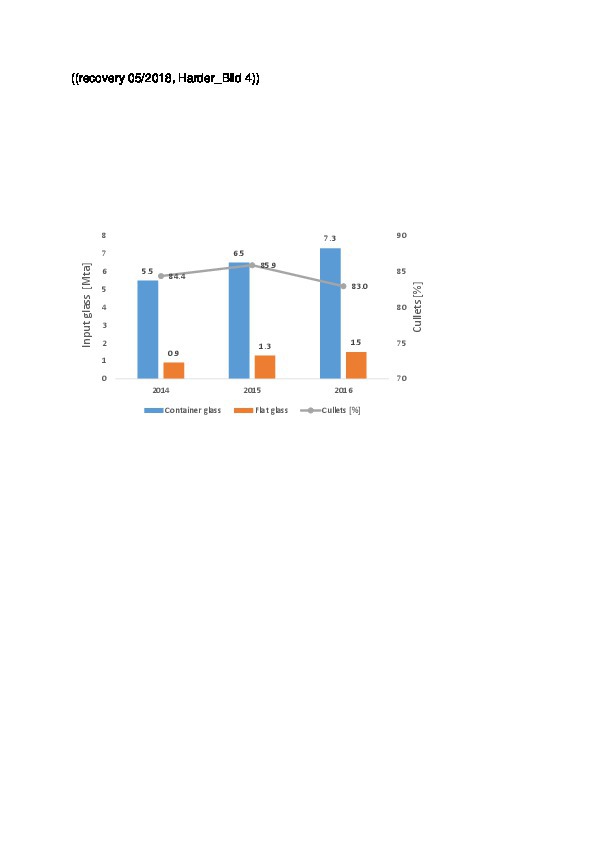
The European Federation of Glass Recyclers (FERVER) is an association of private and independent glass recycling companies. In 2016, the association consisted of 42 companies with a total of 82 glass processing plants. In that year, revenues of € 508 million were generated by the member companies. Fig. 4 shows the most recent data for glass recycling quantities processed by FERVER companies. The total volumes of container glass and flat glass increased from 6.4 Mta in 2014 to 8.8 Mta in 2016. The proportion of container glass decreased in this period from 85.9 % to 83.0 %, i.e. the proportion of flat glass increased slightly by 2.9 %. The quantities of recycled glass supplied to glassworks (so-called cullets) increased from 5.4 Mta to 7.3 Mta, but this means that the proportion of cullets decreased from 84.4 % to 83 %. FERVER claims that its members process 70 % of Europe‘s recycling volumes, which is approximately 10.4 Mta.
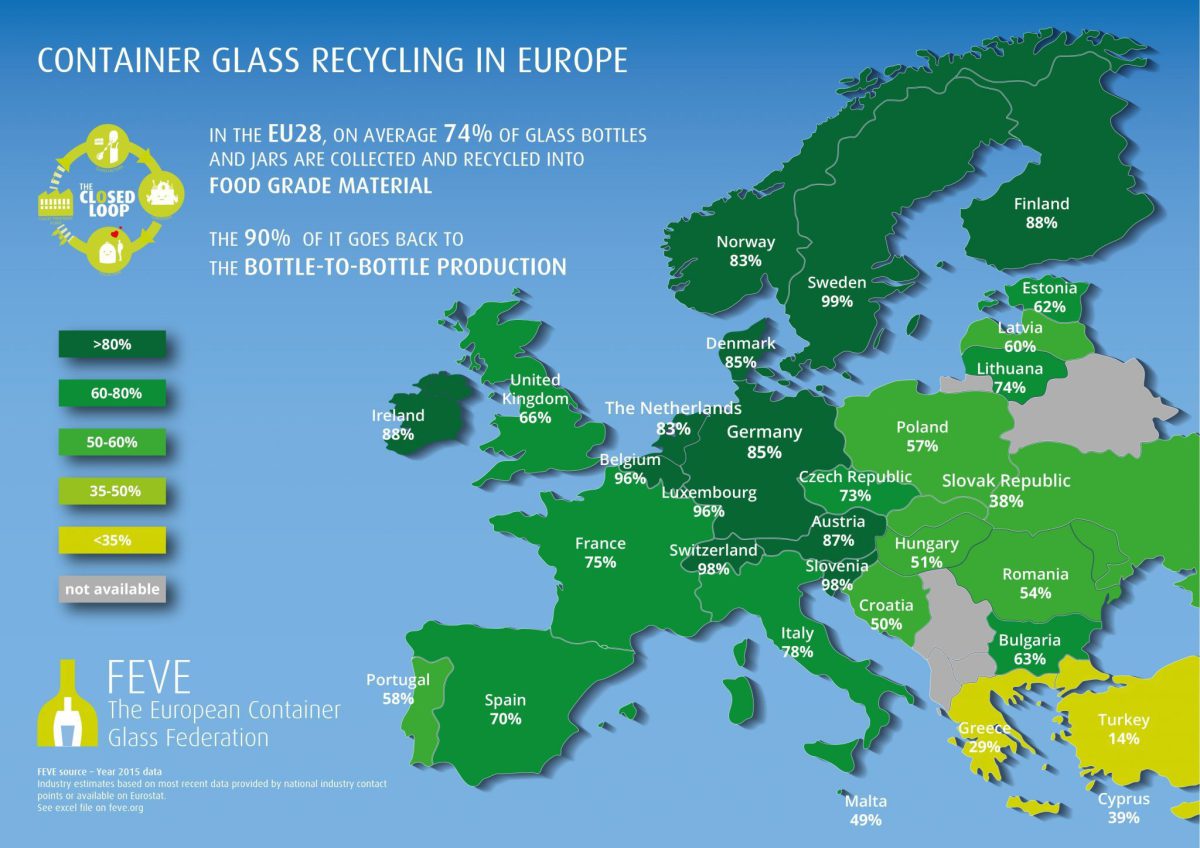
For container glass, the recycling rate in the EU-28 is stable at 74 %. More than 11.6 Mta of glass bottles were recycled in 2015 according to data from the European Container Glass Federation (FEVE) [1], which ultimately leads to higher numbers than those given by FERVER. However, there is still a large north-south and west-east divide (Fig. 5). Countries such as Sweden, Belgium and Slovenia, which have efficient separate collection systems, perform best and achieve recycling rates in excess of 95 %. Countries such as Turkey, Greece, Cyprus and Malta are the worst performers. Here, the recycling rates for container glass are sometimes well below 50 %. This is particularly a consequence of the so-called collection gap in these countries, lack of government incentives and the general economic framework.
2.2 Rest of the world
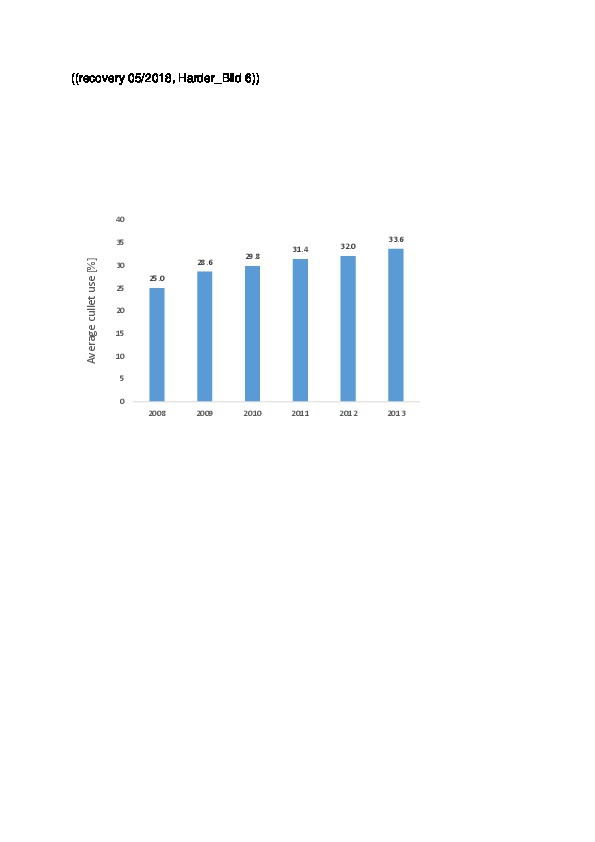
Compared to the rest of the world (RoW), recycling rates in Europe are very high, especially for container glass. The US Glass Packaging Institute (GPI) currently estimates that the container glass and flat glass industry in the US uses a total of 3.35 Mta of recycled glass. The greater part of this quantity is made up of container glass (Fig. 6). The proportion of recycled glass in US container glass production increased from around 25 % in 2008 to 33.6 % in 2013. Currently, it is estimated to be around 35 %. Originally, the goal was to achieve a recycling rate of 50 % in 2013. According to the GPI, the number of recycling plants in the US has grown to 80. On average, an American consumes about 820 beverage packs per year – this relates to glass, aluminum, plastic and paper packaging. The total recycling rate is 37 %.
Very little reliable data is available for other countries. In the case of China, it is assumed that the recycling rate for container glass is currently still below 20 %. It is reported by various sources that recovered glass still has a relatively low financial value in China and the numerous glassworks prefer natural raw materials. This may also have something to do with the fact that most recycling lines are not yet equipped with modern sorting techniques, so that the recycled glass does not meet the quality requirements. Meanwhile, however, a trend reversal has taken place in many countries. A good example of this is South Africa, where over 41 % of glass is now recycled and more than 4000 „bottle banks“ have been installed for glass collection.
3 Developments in European countries
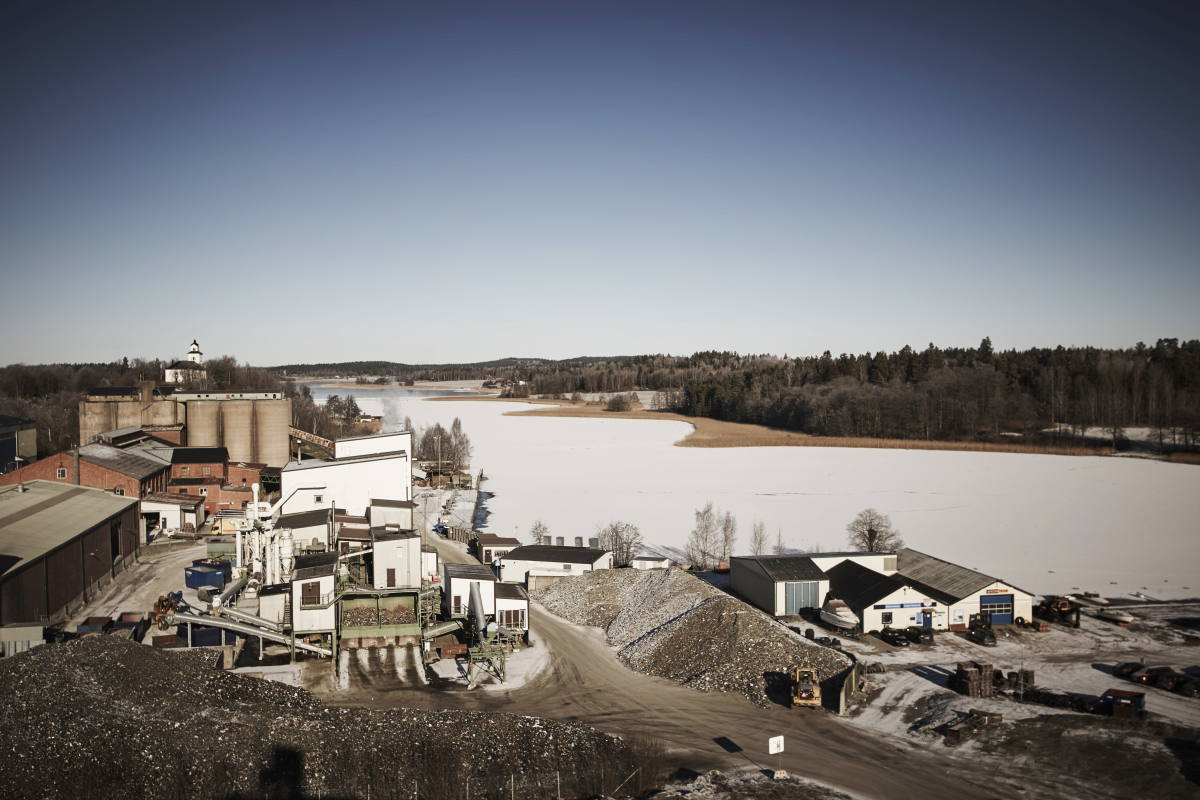
3.1 Sweden
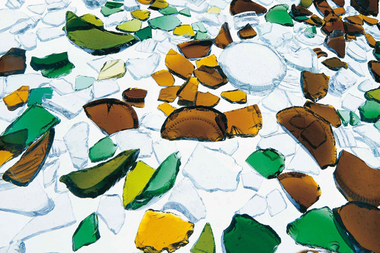
Sweden is considered a model country for glass recycling. In recent years, recycling rates have always been over 95 %. Specifically, 21.5 kg of glass were recycled per inhabitant in 2017. Sweden has a very dense network of 5000 collecting stations. White glass and coloured glass are collected separately (Fig. 7). The system is relatively simple and is financed by means of levies of 0.02 to 0.3 SEK per bottle imposed on the manufacturers of all glass bottles for cosmetics, pharmaceuticals, food and beverages. The system is based on a law passed in 1994. In addition, revenues are generated by selling the cullets to the glass manufacturers. The collection of glass is widely accepted by the population. The collecting stations are kept scrupulously clean and emptied regularly, generally on a filling-sensor-controlled basis.
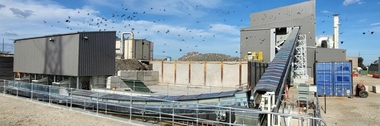
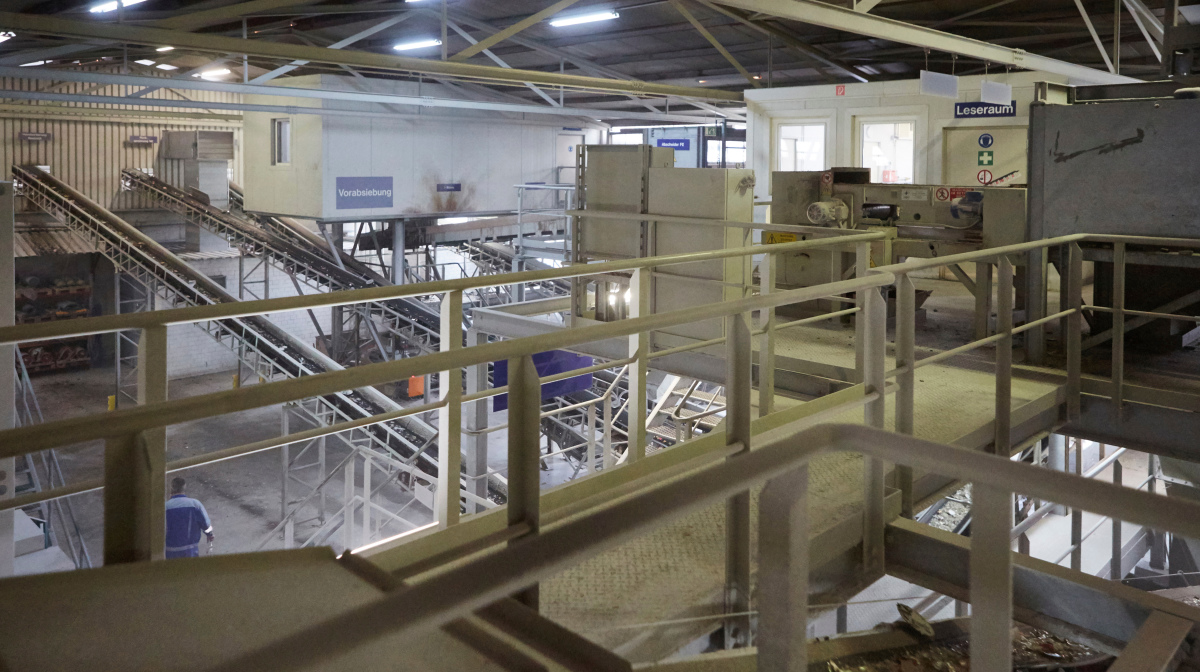
Glass collection and recycling are managed by the Swedish Glass Recycling organization (Svensk Glasåtervinning), which in turn is a member of the Swedish Packaging Federation (FTI). The FTI is a non-profit organization, so that the revenues (SEK 37 million in 2017) are reinvested in the recycling system. At present, Sweden only has one glass processing plant (Fig. 8) in Hammar, to the west of Stockholm, which has a capacity of approximately 0.25 Mta. About 2/3 of the recovered glass is processed for the production of new glass bottles, while 1/3 goes into the production of glass wool and foam glass. The customers are local glassworks such as Ardagh in Limmared. Although Hammar is centrally located in Sweden, there are voices seeking a much wider network of processing plants.
3.2 Germany
In Germany, approximately 1.88 Mta of container glass was collected in 2015 from private households alone. This corresponds to a quantity of 23 kg per head of population. This figure has been largely stable since 2006 (24 kg), although the specific weight of beverage bottles in particular has decreased significantly. A comprehensive collection system for container glass was introduced as early as 1974. At present, the collection infrastructure consists of around 300 000 waste glass containers.
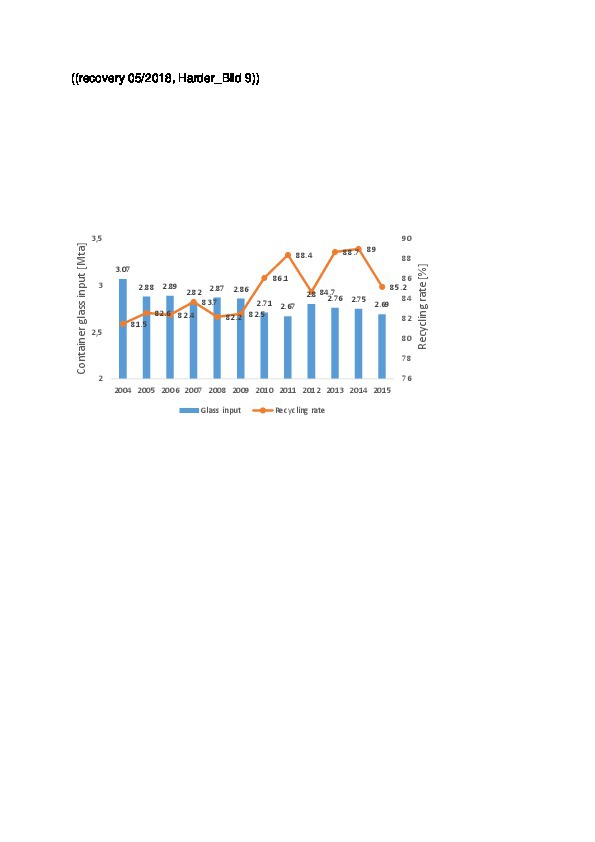
Fig. 9 shows the development of the container glass input volume in Germany and the corresponding recycling rate. It can be seen that from 2004 to 2015, the volume of glass packaging decreased slightly from 3.07 Mta to 2.69 Mta, while the glass recycling rate increased from 81.5 % to 85.2 % over the period, with a peak recycling value of 88.4 % in 2011.
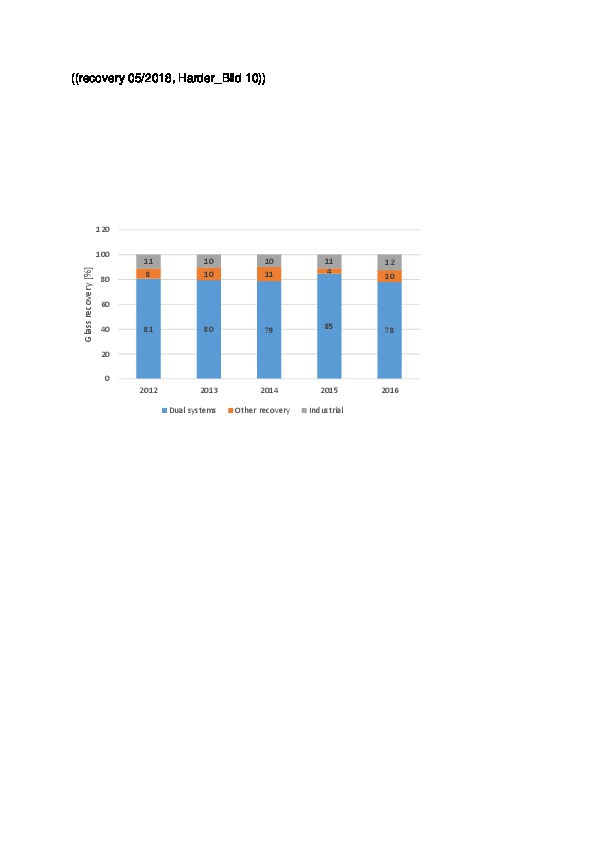
The recycling volumes of glass packaging in Germany are shown in Fig. 10. The main input quantity for the recycling of waste glass comes from the dual systems of waste collection. From 2012 to 2016, 1.91 Mta and 1.88 Mta respectively of waste glass were recovered via these systems, accounting for around 81 % and 78 % respectively of the recycling volumes. Approximately 10 % comes from the other glass recovery routes (industry solutions, self-management take-back systems up to 2014 and non-returnable beverage bottles with refundable deposit). This accounted for about 0.23 Mta of glass packaging in 2016. A further 10 to 12 % come from commercial glass sources. The quantity of waste glass recovered from commercial sources consists essentially of returnable bottles which were sorted out by the filling companies because of defects. In 2014, Germany had 20 waste glass processing plants.
3.3 Italy
Italy achieves the highest glass recycling rates of the southern European countries. The recorded input quantities of glass packaging and the recycling rates since 2006 are shown in Fig. 11. In Italy, there has been an increase in the quantity of waste glass from 2.13 Mta to 2.34 Mta and also in the recycling rate from 58.9 % to a substantial 70.9 % (78 % according to FEVE) [2]. There are, however, very large differences from north to south (Fig. 12). In the north of the country, South Tirol for example, 45.1 kg per person were recycled, contrasting strongly with the south and its mere 6.9 kg per person in Sicily or 13.1 kg per person in Calabria. The CoReVe organization, responsible for the separate collection of container glass in Italy, started an initiative for Southern Italy in 2017 with the aim of increasing recycling volumes there by 10 % in one year. To this end, know-how and financial incentives are being provided.
4 Glass production and recycling
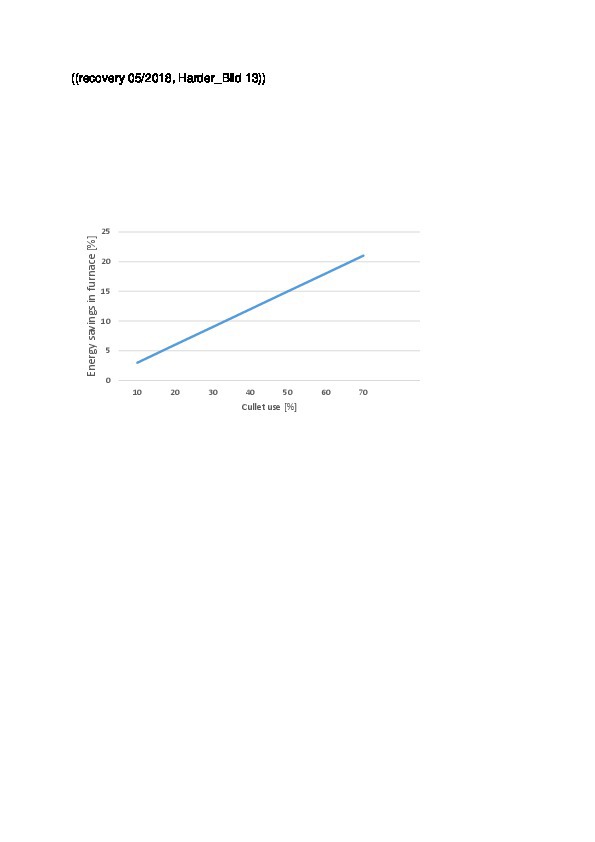
Glass recycling is subject to general economic conditions. In this connection, it should be noted that the energy consumption of the glass production process decreases by about 3 % if 10 % of natural raw materials are replaced by recycled glass cullets (Fig. 13). Accordingly, when using a 65 % portion of glass cullets, the achieved reduction in energy consumption is 20 %. Lower energy consumption also leads to reduced carbon dioxide (CO2) emissions. The most important factor in terms of economic conditions is the price of recycled glass. If this price exceeds the achievable savings in natural resources and energy consumption, it reduces the chances of recycling.
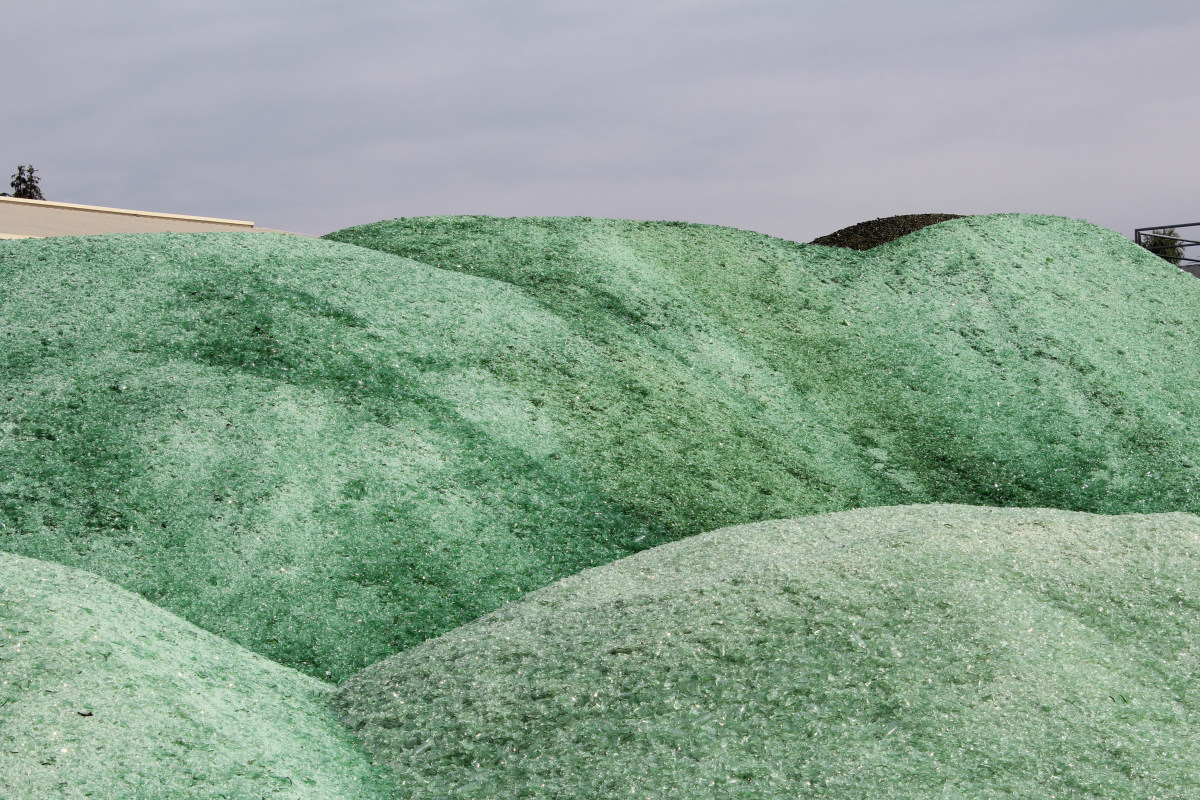
Depending on the effectiveness of glass colour separation, melting furnaces in glassworks can use different proportions of recycled glass cullets. The amount of recycled material in the production of green glass is 90 %, in some cases also reaching values of 95 %. In the case of brown glass the recycling rate is 70 %, while the production of white glass generally only permits a recycling rate of 60 %. The use of recycled glass is subject to stringent quality requirements. For instance, according to a guideline of the Federal Association of the German Glass Industry [3] relating to container glass, the contamination by earthenware, stones and porcelain (ESP) should not exceed 20 g/t. There are also limit values for metals, glass ceramics and organic contaminants. The content of different colour glass is also limited. White glass should contain not more than 0.2 % green glass, 0.3 % brown glass and 0.2 % other colour glass. Green glass should consist of at least 70 % green glass and not more than 10 % brown glass. Brown glass should consist of at least 80 % brown glass.
4.1 Container glass
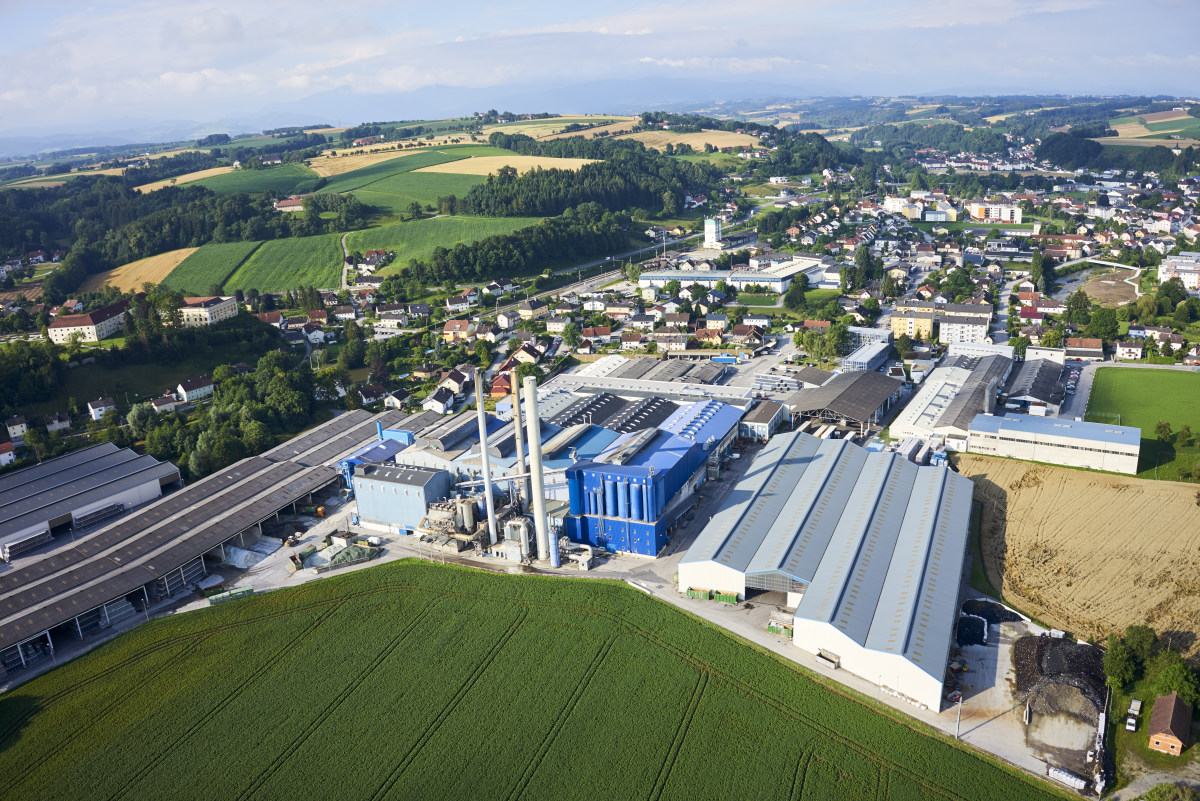
In the EU, container glass is manufactured in 162 glassworks. The European association has 60 member companies belonging to about 20 different corporate groups. The leading glass packaging manufacturers in Europe include Vetropack, Verallia and Owens-Illinois. Vetropack started promoting the collection and reuse of waste glass over 40 years ago. The company has manufacturing locations in Switzerland, Austria (Fig. 14) and 5 other EU countries and produces more than 2500 different glass packagings. At Vetropack, waste glass has become the most important raw material in the glass production process. In 2017, the company used an average of 53 % waste glass for its container glass production. The recycling rate was 67 % for green glass, 48 % for brown glass and 43 % for white glass. In some Vetropack glassworks, waste glass usage rates of 83 % are achieved.
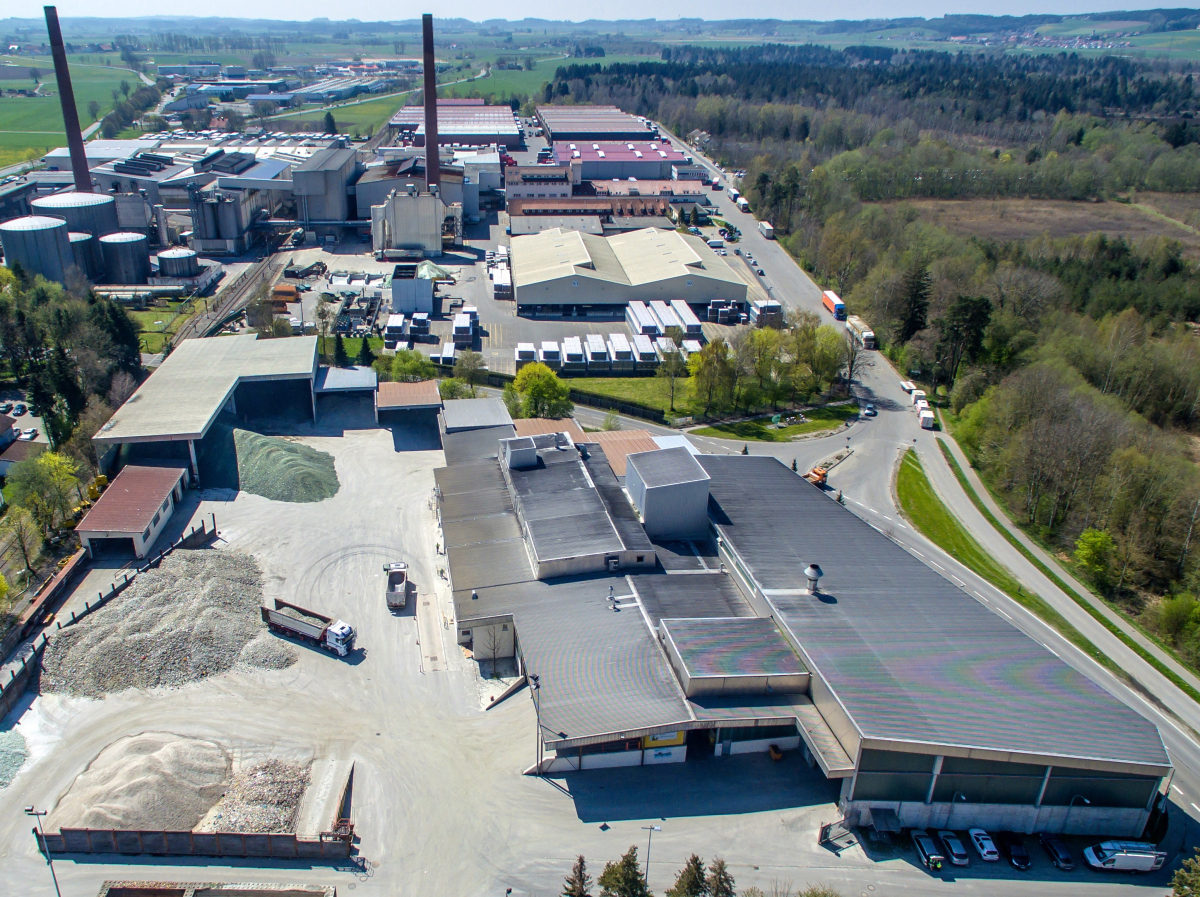
The Verallia Group is the No. 1 in Europe for container glass and the No. 3 worldwide. The company is represented in 11 countries with production plants and a total of 32 glassworks and 57 melting furnaces. In 2017, Verallia produced around 16 billion bottles and glasses, and the group‘s sales totalled € 2.5 billion. The company owns its own waste glass processing plants (Fig. 15), but also purchases processed cullets. In the field of quality management, great importance is placed on the quality of raw materials and in particular the quality of the recycled glass (Fig. 16). Verallia has improved the technology of processing plants to make higher recycled glass usage rates possible. From 2015 to 2017, the company increased its recycling volume by 4 %, from 2.65 Mta to 2.76 Mta, while the usage of primary raw materials was reduced by 10.7 %, from 4.02 Mta to 3.59 Mta.
Owens-Illinois (O-I) is the No. 2 glass packaging company in Europe with 34 glassworks in 10 EU countries and also the No. 1 worldwide with a total of 78 plants in 23 countries. According to figures from the 2014 Sustainability Report, the company had bought in a total of 4.7 Mta of glass cullets, achieving a recycling rate of 38 % in its global companies. In Europe, O-I‘s recycling rate was 49 %, Asia Pacific region 36 %, Latin America 28 % and North America only 26 %. The company is working to increase these amounts, especially in the core markets of North America and Latin America.
4.2 Flat glass
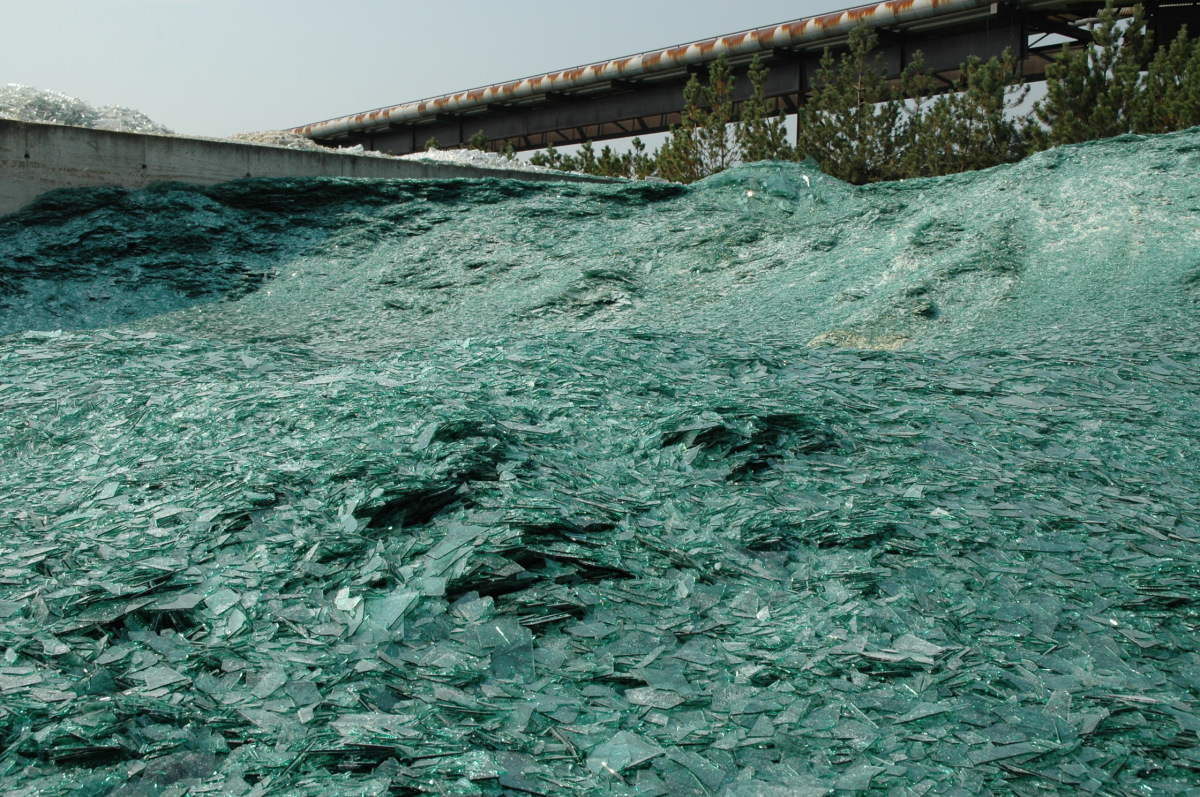
The global leaders in flat glass production include Asahi Glass (AGC), Saint Gobain, Nippon Sheet Glass (NSG) and Guardian. The total global market share of these companies is almost 60 %. In the EU, flat glass can be produced at 60 locations in 12 countries. Most plants are located in Germany, France and Poland. At the moment, some plants have been mothballed or taken out of operation. The requirements placed on waste glass from glass recycling systems are far higher than they are in the case of container glass. For example, most manufacturers only tolerate an ESP content of 5 g/t of glass cullets (Fig. 17). For this reason, waste glass from the demolition of buildings has not so far found any use in the production of flat glass. This situation will also not be changed by the fact that new EU regulations (Waste Framework Directive 2008/98/EC) stipulate an increase in recycling of demolition materials to 70 %. Glass accounts for less than 1 % of such demolition materials [4].
In order to nevertheless get an idea of the recycling rates of flat glass manufacturers, 2017 figures from Saint-Gobain are of interest. Saint-Gobain is the No. 1 in Europe and also plays a leading role in glass recycling. Besides its flat glass production, the company also manufactures glass wool. In 2017, the company consumed 6.96 Mta of primary raw materials for its glass production. The quantity of recycled glass from its own cullets (broken glass and scrap) was 1.88 Mta, while the quantity of bought-in cullets was 1.36 Mta. Compared to 2015, in particular the proportion of bought-in material increased significantly by 20 %. This means that Saint-Gobain achieves a recycling rate of about 30 % in flat glass production and about 41 % in glass wool production.
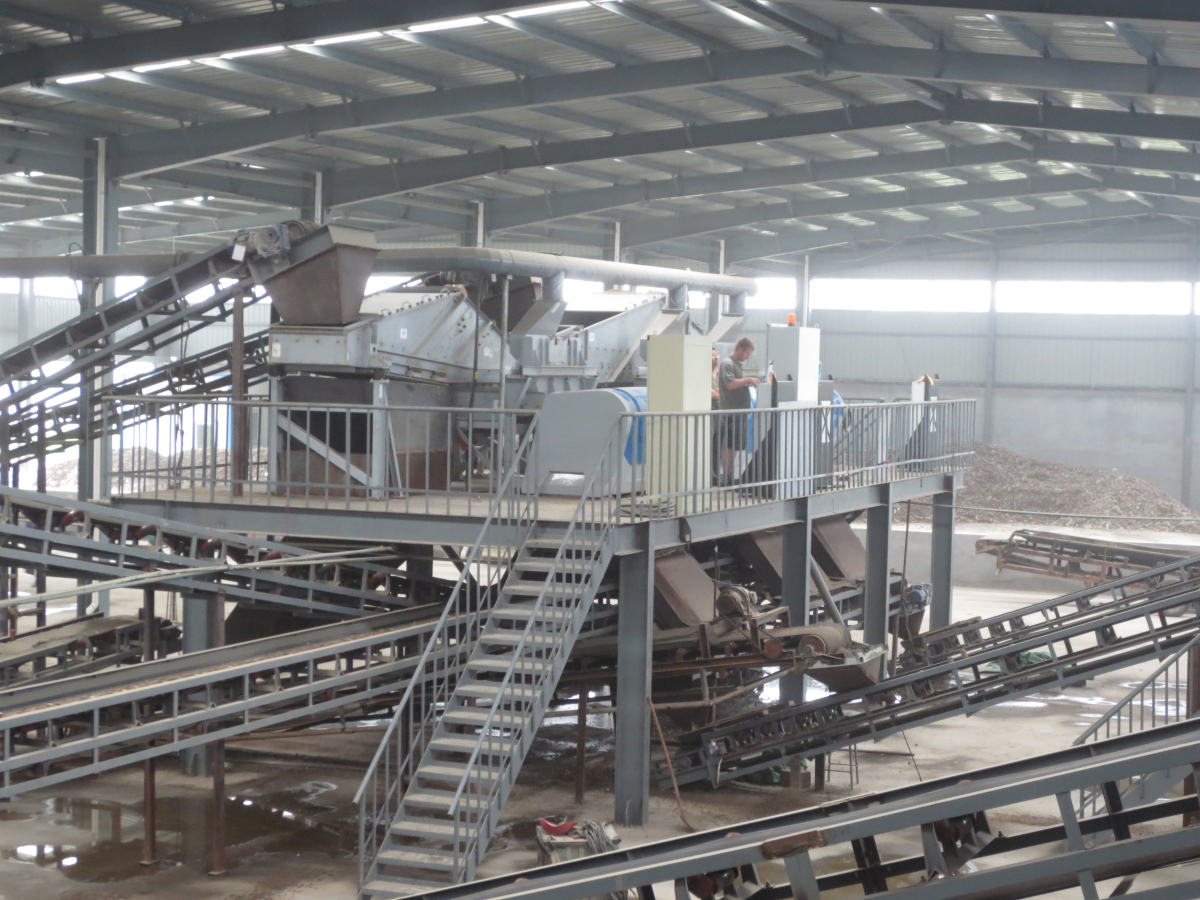
5 Technologies
Industrial glass recycling started in the late 1960s. Today, glass recycling takes place in the 4th generation of processing plants. Initially, purely mechanical processes were used, such as crushing and screening. Later, metal separation processes were added. Contaminants such as earthenware, stones, plastics and organic materials were still sorted out manually. Optical glass sorting processes came onto the market in the late 1980s. Today, virtually all contaminants, such as heat-resistant glass ceramics or glasses containing lead oxide, can be sorted out with optical methods. Modern plants are now equipped with glass drying systems in order to fully exploit the sorting possibilities. This has enabled e.g. the ESP content of the recycling glass to be reduced from an input value of 500 ppm to below 25 ppm.
Additional waste glass sorting stages are incorporated in order to achieve the following objectives:
Improvement of the cullet quality (reduced content of other colours, lower ESP content)
Increasing the recovery rate of raw cullets
Increasing the cullet usage rate
For the technical implementation of glass recycling, the following processes – with additional sorting systems – are necessary:
Removal of labels adhering to the glass cullets
Drying the cullets prior to the automatic sorting
Sorting in the lower grain-size categories (< 5 mm)
To enable recycling of multilayer glass (laminated glasses, windshields) or solar glass, special techniques are used in the processing plants. In 2018, for example, France‘s first solar panel recycling plant was put into operation by PV Cycle France. In 2018, this plant will process 1300 t of solar glass, which corresponds approximately to the total end-of-life quantity for solar panels in France. It is planned that the capacity will be increased to 4000 t by 2022.
Glass recycling technologies are offered by a number of companies. Among the leading suppliers are Zippe Industrieanlagen in Wertheim/Germany, who are also one of the leading manufacturers of batch plants for the glass industry with more than 600 installed plants. There are also two Austrian companies: Binder+Co and BT-Wolfang Binder (Redwave), both located in Gleisdorf. Binder+Co supplied, for example, the first fully automatic waste glass processing plant for the Greater Beijing area (Fig. 18) with a plant capacity of 36 t/h. The preconditioning of the glass cullets is carried out with a roll crusher, a special screening machine, a label remover and an eddy current separator for the metal fraction. Four sensor-based sorting machines of the CLARITY series provide a three-stream sorting system for highly precise separation of the pre-sorted material by colour and contaminants.
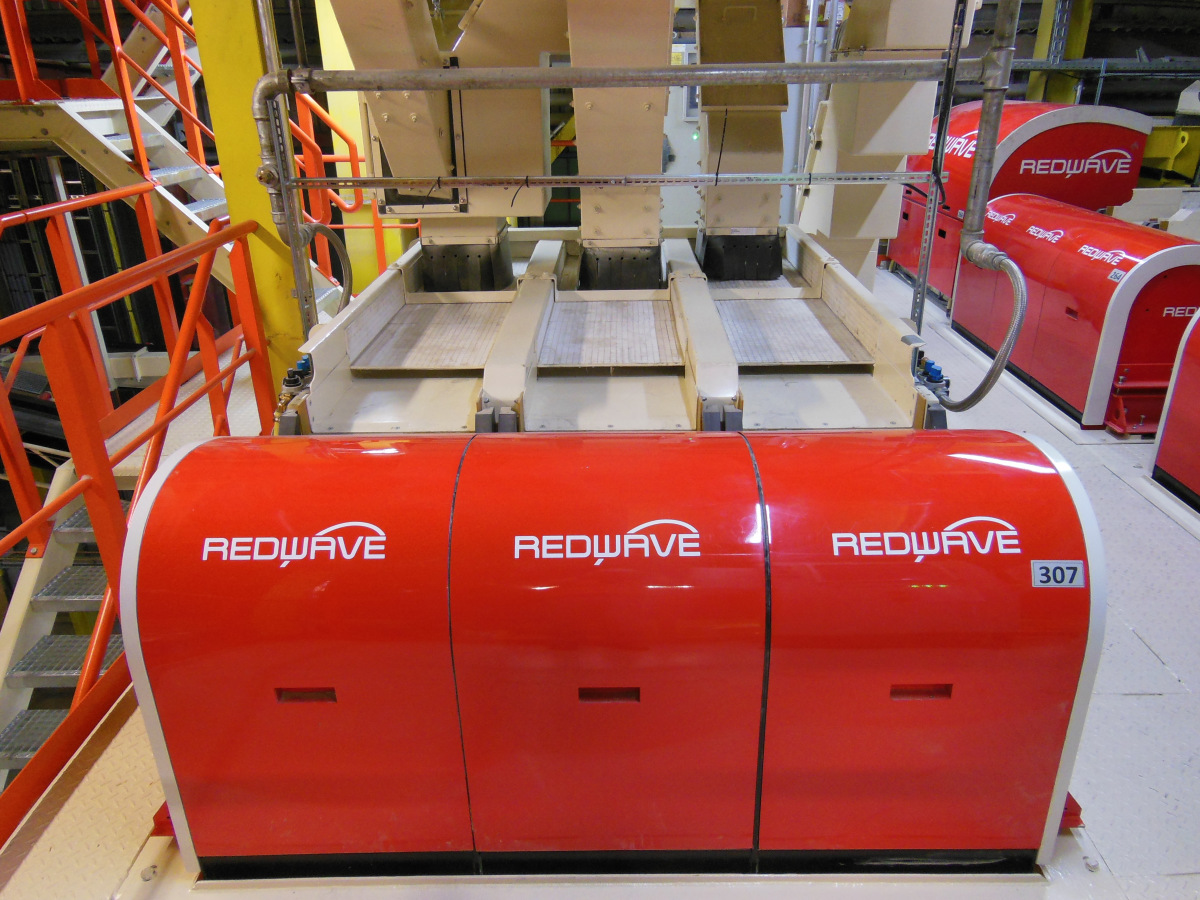
Redwave uses different market-leading techniques for its sorting system (Fig. 19). For sorting out earthenware, stones and porcelain (ESP), cameras with transmitted light are used. For the removal of lead glass and glass ceramics, as well as for the processing of cathode ray tube glass, X-ray fluorescence (XRF) techniques are used. Near-infrared (NIR) spectroscopy is used for the removal of plastics, acrylic glass and laminated glass. Camera systems with transmitted light technology are also used for the actual color sorting and color resorting into white, green and brown glass.
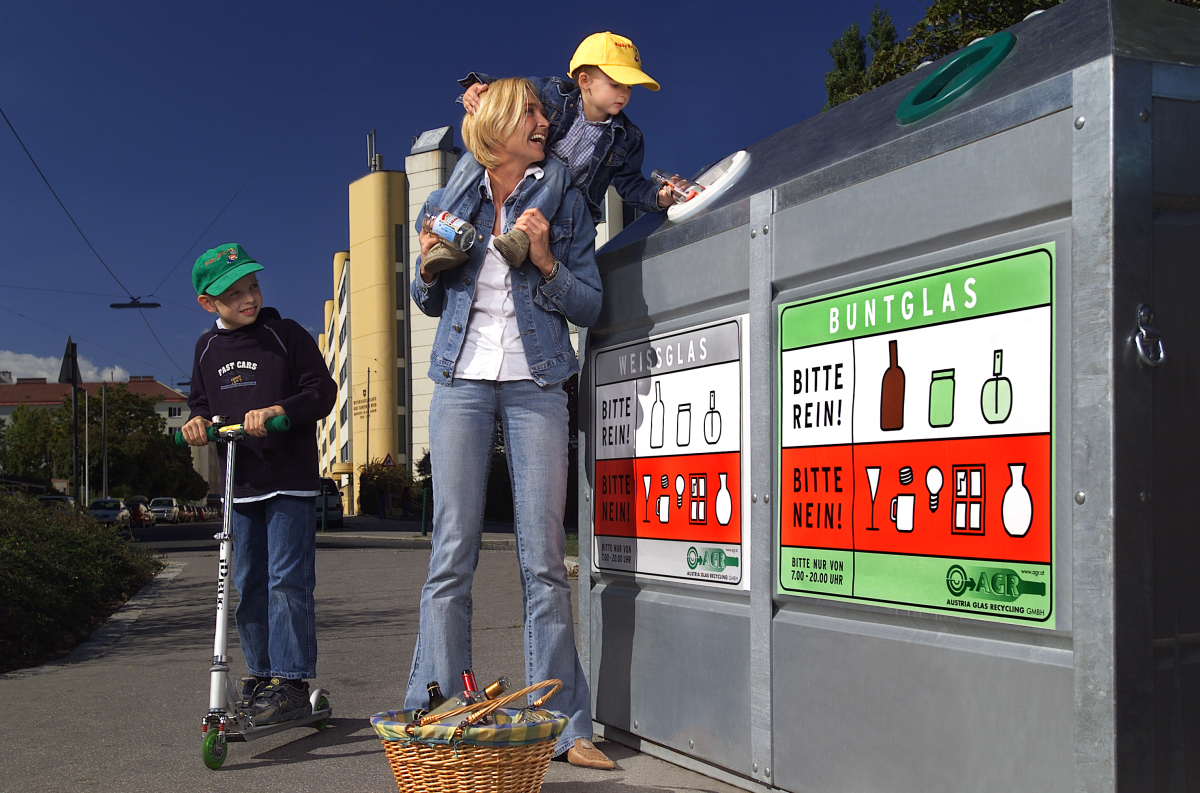
6 Market prospects
The market for glass recycling is booming and glass collection (Fig. 20) is in vogue. Among other factors, improved concepts for glass collection containers are supporting this trend. Several market research institutes predict high growth rates of 7 to 8 % up to 2025. The market is still dominated by Europe with her share of almost 50 %. However, in the leading countries such as Germany, France, Italy, Spain and England high growth rates are not expected. Prospects of strong market growth are particularly evident only in North America and in the emerging markets in Asia, South America and Africa.