Recycling a multifunctional material
 © Joshua Sütterlin Photography
 © Nippon Electric Glass
 © BV Glas
 © OneStone Research
 © Glass Alliance Europe
 © Glass Alliance Europe
 © FEVE
 © Vlakglasrecycling Nederland
 © FERVER
![9 Data analysis on glass recycling [3]](https://www.recovery-worldwide.com/imgs/2/0/1/0/4/8/6/09_Bild9L_GlassLoop1-902ebc83ac573f45.jpeg)
 © GPI
© GPI
 © GPI
© GPI
 © JCPRA
 © Schott Glass
 © Saint-Gobain
 © Commune d‘Aniche
 © Pilkington United Kingdom Limited
 © Guardian Glass
 © Reiling Unternehmensgruppe
 © FERVER
Glass has more applications than any other material. It is not only essential for us in our everyday life, it is also important for many new technical developments. As glass can be remelted after use, a closed loop would be possible. In practice, however, this is seldom achieved, even if there is often talk of high recycling rates. In this article, circumstances are described and insights into the container and flat glass industry are given.
1 Introduction
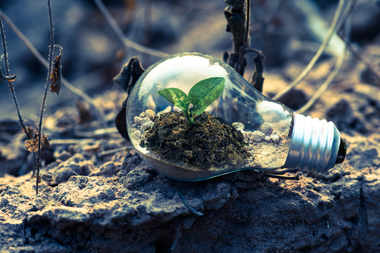
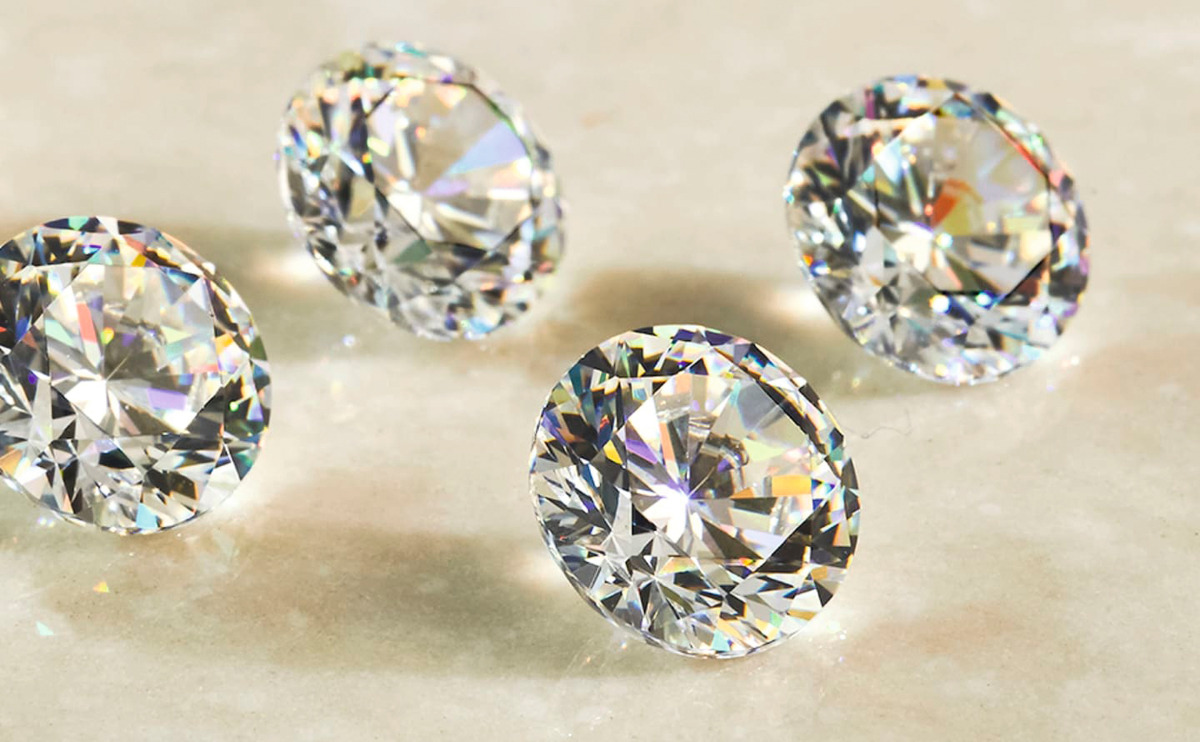
Over the history of humanity, materials have repeatedly brought progress. After the Stone Age and Iron Age, we have now arrived in the glass age. The UN declared 2022 as the international year of glass. Innovations made of glass have advanced humanity. Starting with the first tools made of rock glass and glass containers in which food could be stored, through window glass, which revolutionized architecture, as well as optical and functional glasses to fibre optics for digitalization, But its development has not reached its conclusion by a long way. Today, glass can be made with a brilliance to match that of diamonds (Fig. 1). New glass modules allow advances in photovoltaics, and recently ultrathin glasses with thicknesses of less than 100 µm have been made for various applications.
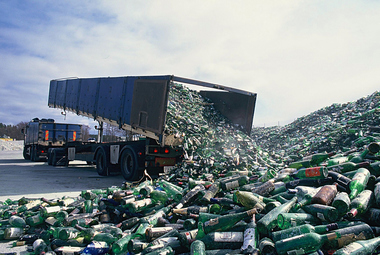
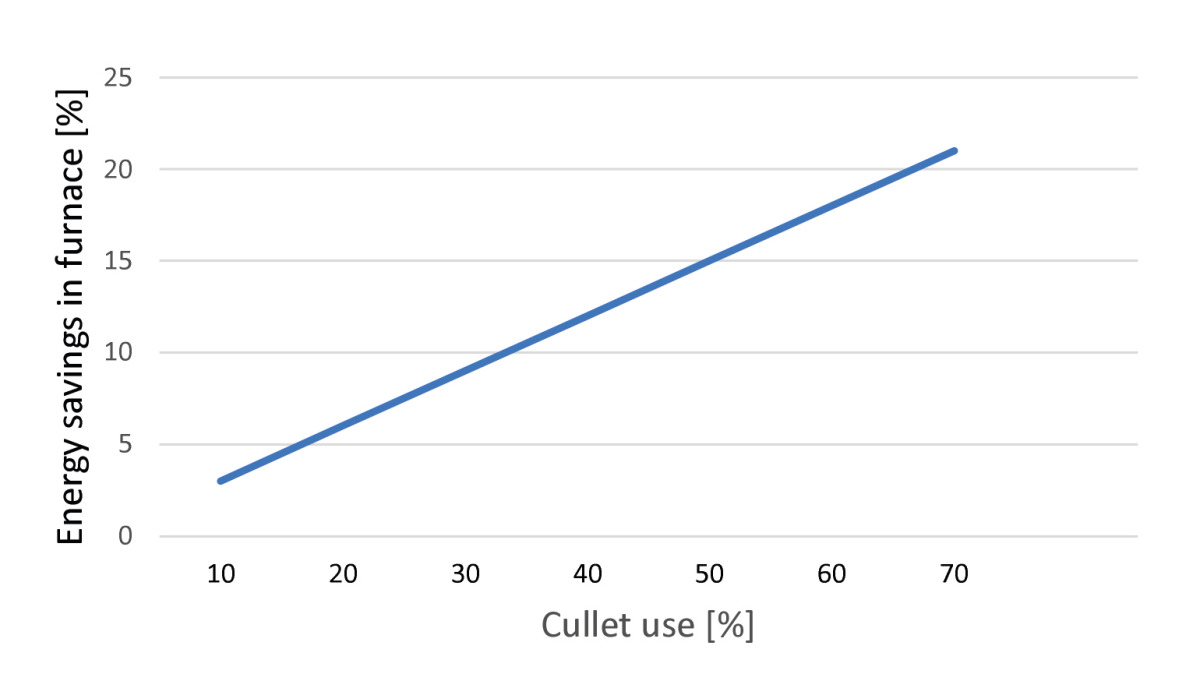
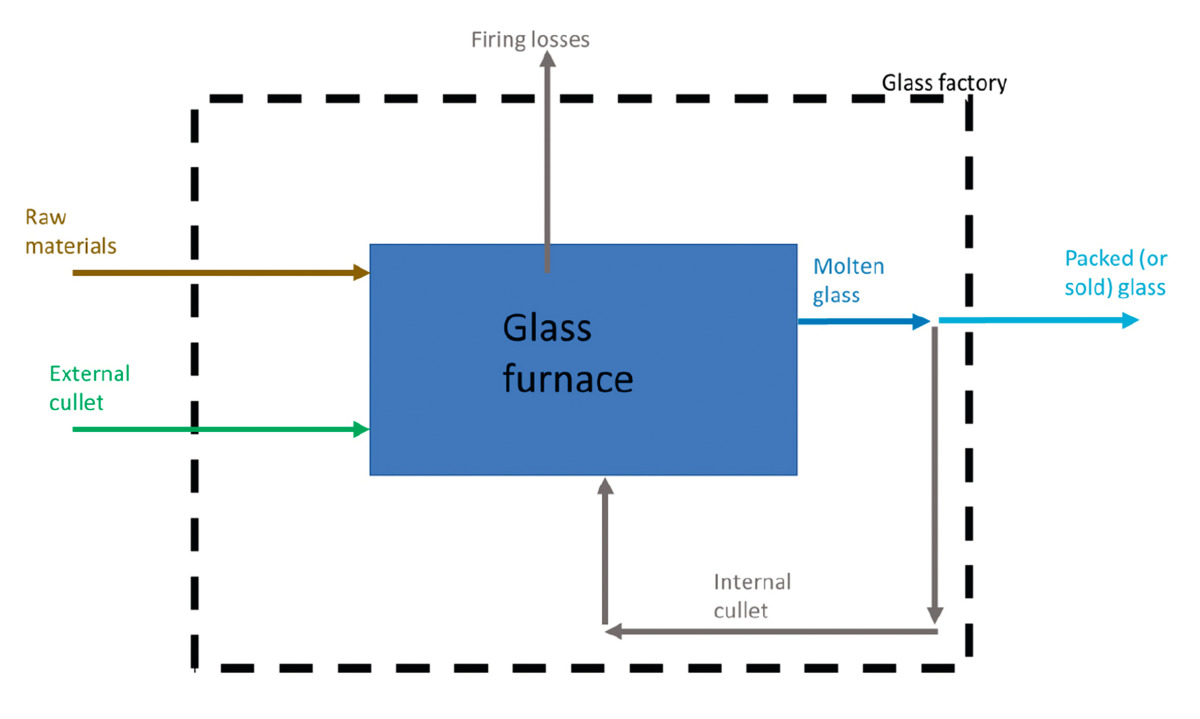
An important property of glass is its recyclability. Glass recycling is becoming more and more important, because for glass production from primary raw materials large quantities of energy and high temperatures of around 1600 °C are necessary. Waste glass can be melted with much less energy (Fig. 2). Per 10 % waste glass in glass raw materials, 3 % energy and around 4 % CO2 emissions can be saved [1]. Correspondingly, with the use of 65 % glass cullet, a 20-% saving in energy consumption is achieved. At the same time, with every tonne of waste glass around 1.2 t primary raw materials are saved. Problematic, however, is that waste glass collection quotas still lag well behind expectations while high quality and purity standards exist for recycling. For float glass, for example, impurities in excess of 5 g CSP (Ceramic, Stone, Porcelain) per tonne of waste glass are not acceptable.
2 Facts on the glass industry and recycling
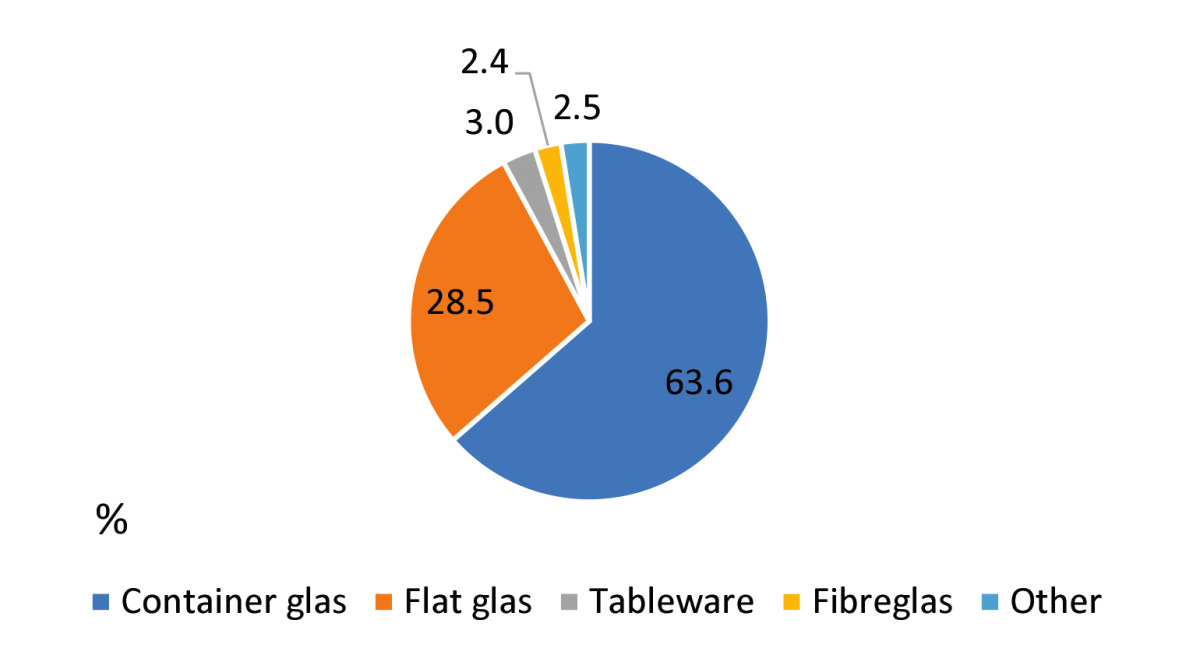
In 2021, around 181 million tonnes of glass products per year (Mta) were produced in around 2500 glass furnaces worldwide. The market value of production corresponds to around US$ 190 bill. The majority of the products come from the production of container glass and flat glass. Only around 13 to 15 % come from the production of speciality glass, glass fibres and household glass. Fig. 3 shows an overview of the existing production capacities. According to this, a total of 245 Mta production capacity are available, that corresponds to a capacity utilization of just under 74 %. Container glass production with around 116 Mta accounts for the biggest capacities, followed by flat glass with 99 Mta and fibre glass with 13 Mta. Over the last five years, the percentages have increased for container glass, while they have fallen for flat glass. Fibre glass shows high increases, household glass strong losses.
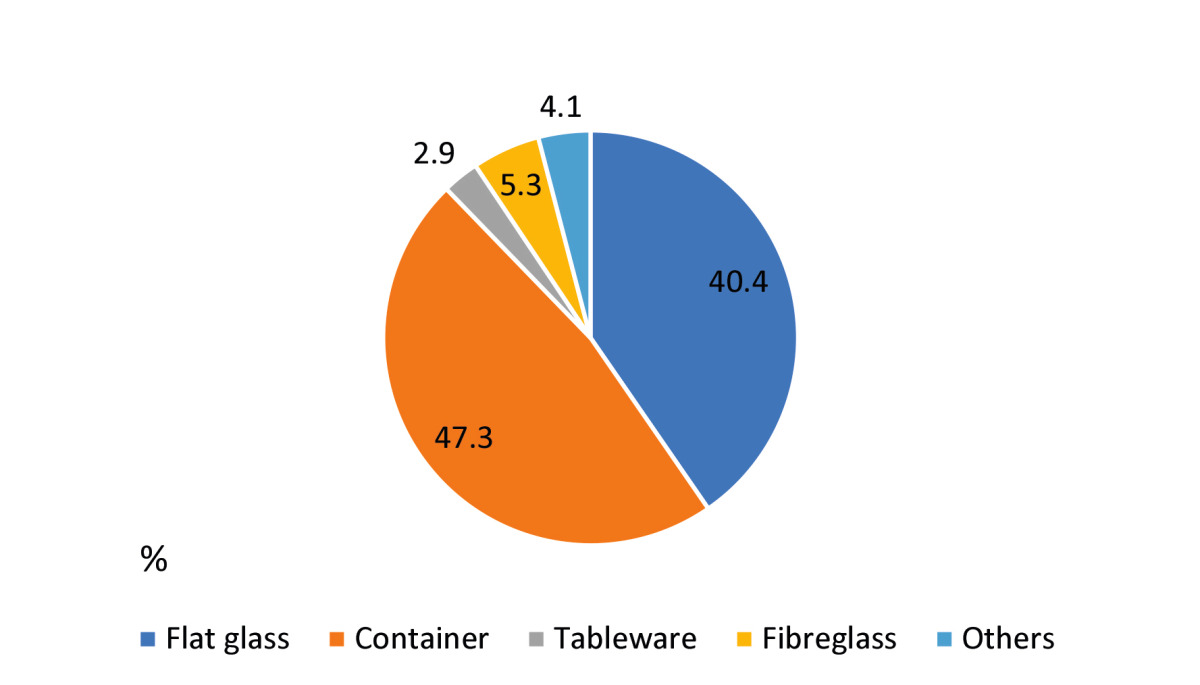
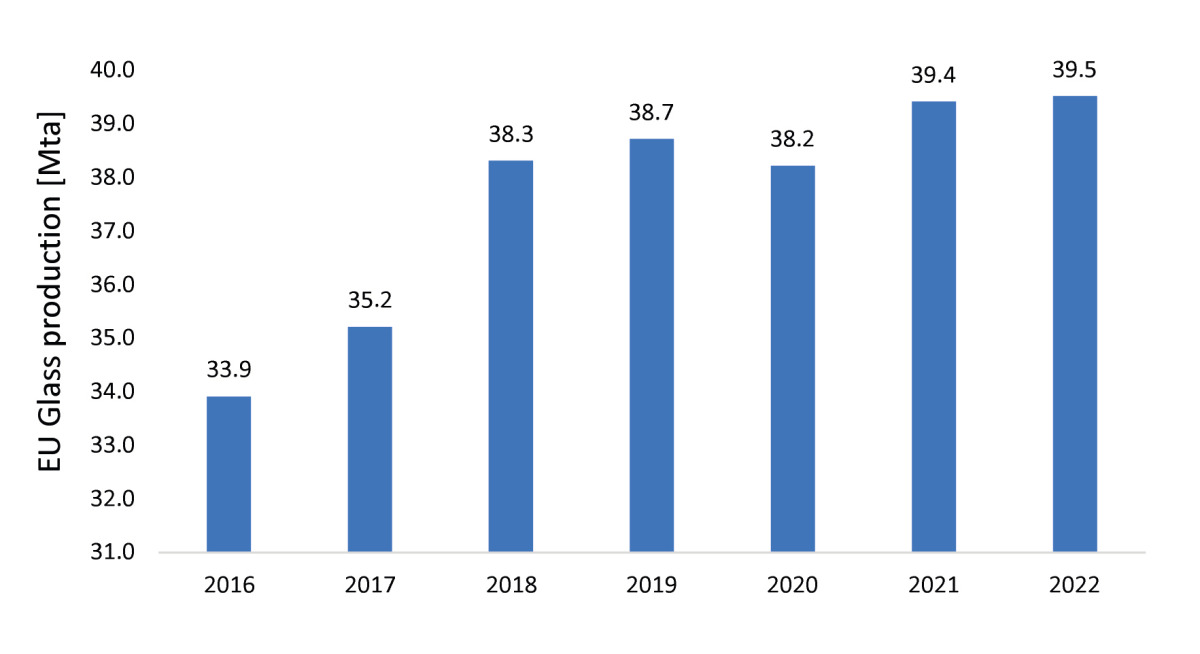
For the EU, market figures are published by the Glass Alliance Europe (GAE). According to these figures, glass production in Europe (EU27 + UK) has increased only moderately in recent years (Fig. 4). With a production of 39.4 Mta in 2021, only a 21.3 % share of global production was achieved. This is also clear from the fact that in 2022, the EU imported around 5.5 Mta glass and exported 4.3 Mta. The exports of flat glass have decreased by 23.5 % since 2021, while the exports of container glass have increased by 13.1 %. For the exports of speciality glass, even losses of 28.6 % were recorded. Interesting also is how glass production in EU is broken down among the individual glass types (Fig. 5). The main quantity with 24.5 Mta or 63.6 % is made up of container glass, followed by 28.5 % for flat glass and 3 % for household glass. Fibre glass and speciality glass each lie under 3 %.
No reliable data is available on the global recycling rates for glass [2]. This is essentially because so far almost only data for the recycling of container glass have been recorded, while as good as no data exists on the recycling of flat glass, household glass and speciality glass. Fig. 6 shows the crux of the problem. Real recycling rates have resulted only from the so-called post-consumer collected quantities, which are mostly cleaned and processed before being fed to the glass melt. All pre-consumer quantities that have not left the glass factory and are, for example as reject material, recycled back into the process make no contribution to recycling. If, for example, flat glass is collected from building demolition, from joineries or car recycling and used for the production of container glass, glass wool or glass blocks, this is not considered recycling, but downcycling. These are the definitions.
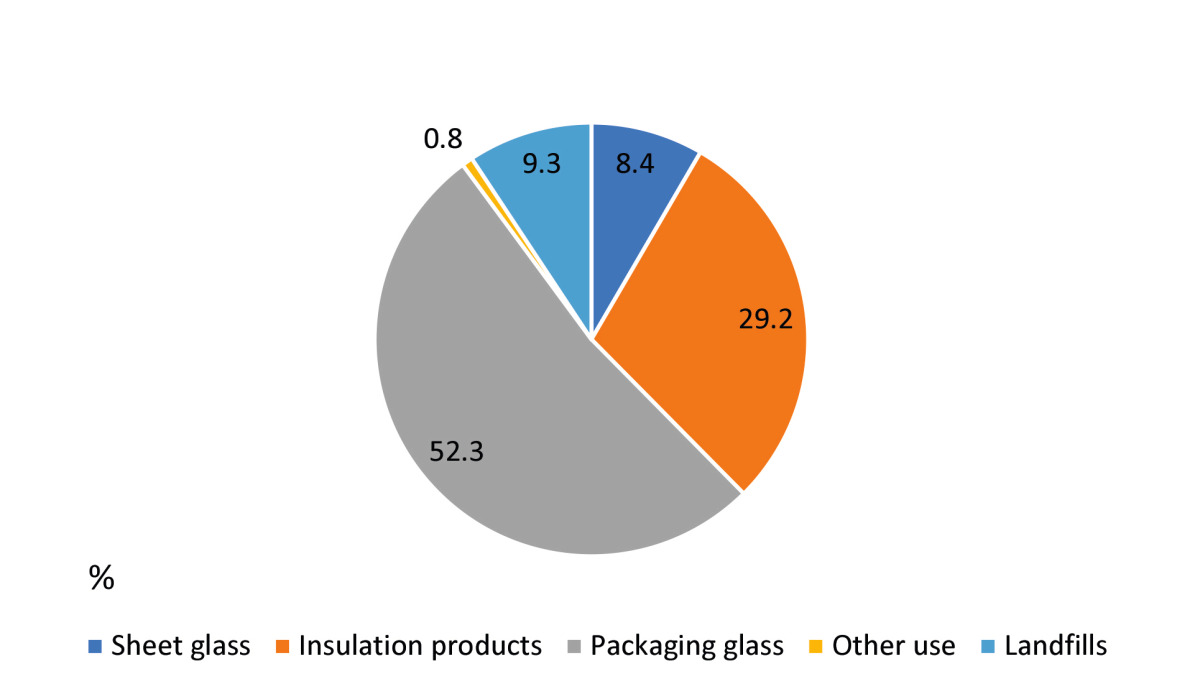
Fig. 7 shows this situation based on the example of the Netherlands, which is regarded as a country with a high percentage for the recycling of flat glass. In 2021 a total of 90.89 kt flat glass was collected from the post-consumer sector. In 2001, this figure was only 2.7 kt. Of the 90.89 kt, only 7.63 kt or 8.4 % was recycled in flat glass production. This is described as real recycling in a closed loop. Easily the largest quantity with 52.3 % was reused in container glass production, another 29.2 % went into the production of glass wool and 0.8 % into other applications. Accordingly, only 8.4 % were recycled while 93.6 % underwent downcycling, i.e. were lost to flat glass production for ever. It is therefore incorrect to say that glass can be recycled as often as you want. This becomes clear if you look at the requirements of the flat glass manufacturers and the long list of the glasses that are not used [1].
3 Container glass
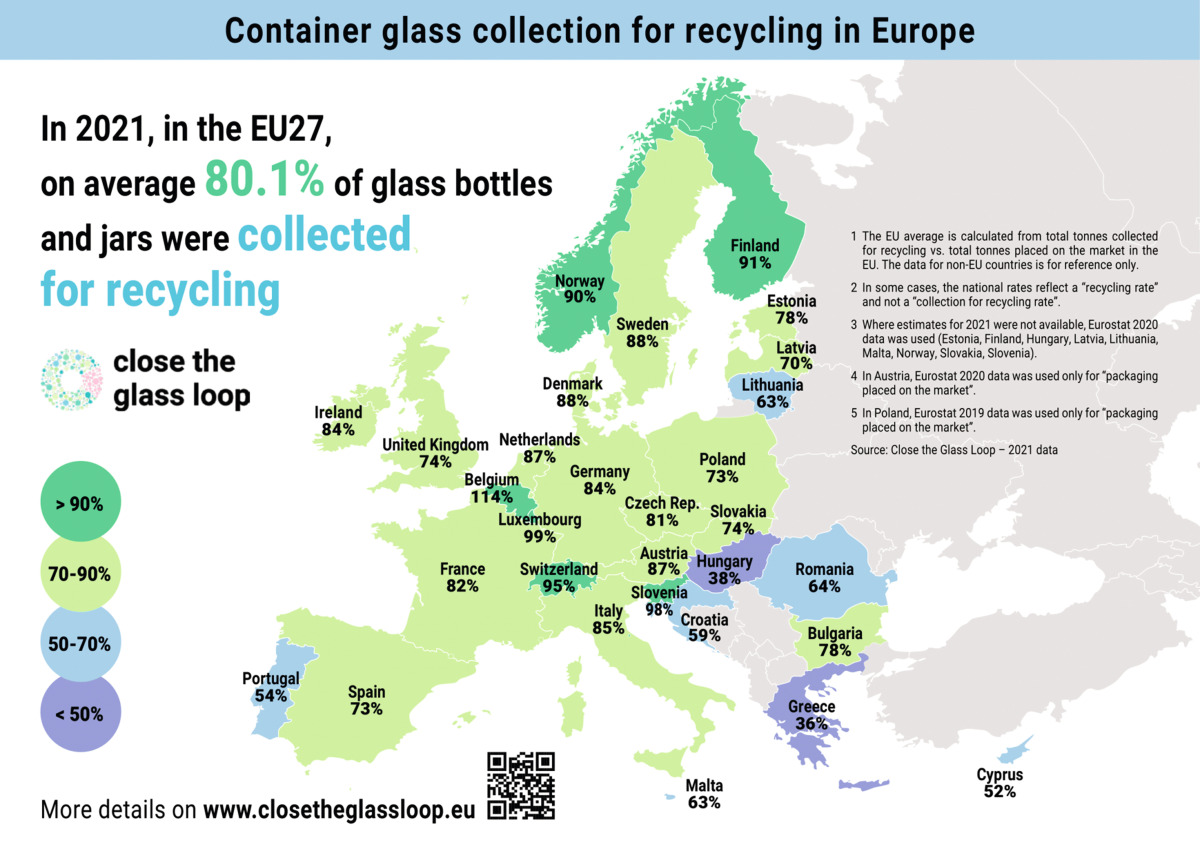
In 2021, in Europe (EU27), with 80.1 %, a new maximum was reached for the collection of container glass for recycling. This value is the quotient from the collected container glass totalling 11.853 Mta and the total of 14.798 Mta container glass newly introduced onto the market in 2021. An average collection rate of 90 % has been targeted for 2030. There are, however, big differences between north and south as well as east and west (Fig. 8). The highest collection rates in Europe are registered in Belgium, Switzerland, Finland and Norway, the lowest collection rates are achieved in Greece, Hungary, Cyprus, Malta and Portugal. In terms of absolute collection figures, Italian reaches the highest figure with 2.417 Mta, followed by Germany with 2.290 Mta and France with 2.240 Mta. In Greece, in contrast, only a quantity of 0.307 Mta container glass is collected.
Information on the recycling rates for container glass in Europe for 2019 is given in an investigation of the organization “Close the Glass Loop” dated 2023 [3]. According to this, in 2019, a total of 13.8 Mta container glass was collected in the EU27 + UK + NO in 2019. 54 % of this material stream, that is 7.5 Mta was traced. 6.9 Mta or 92 % of the waste glass comes from public waste collection, 0.5 Mta or 6 % come from other collection routes and 0.1 Mta or 2 % is waste glass that cannot be recycled. For each of the 17 countries surveyed, there were very different results. The overall finding, as shown in Fig. 9, is that from the 7.5 Mta, a total of 92 % were fed into a closed recycling route. 8 % were melted for other glass uses or reused elsewhere. The actual recycling rates (percentage recycled in 2021) for container glass in the EU27 + UK probably only reached just under 65 %, after 52 % in 2012 [4].
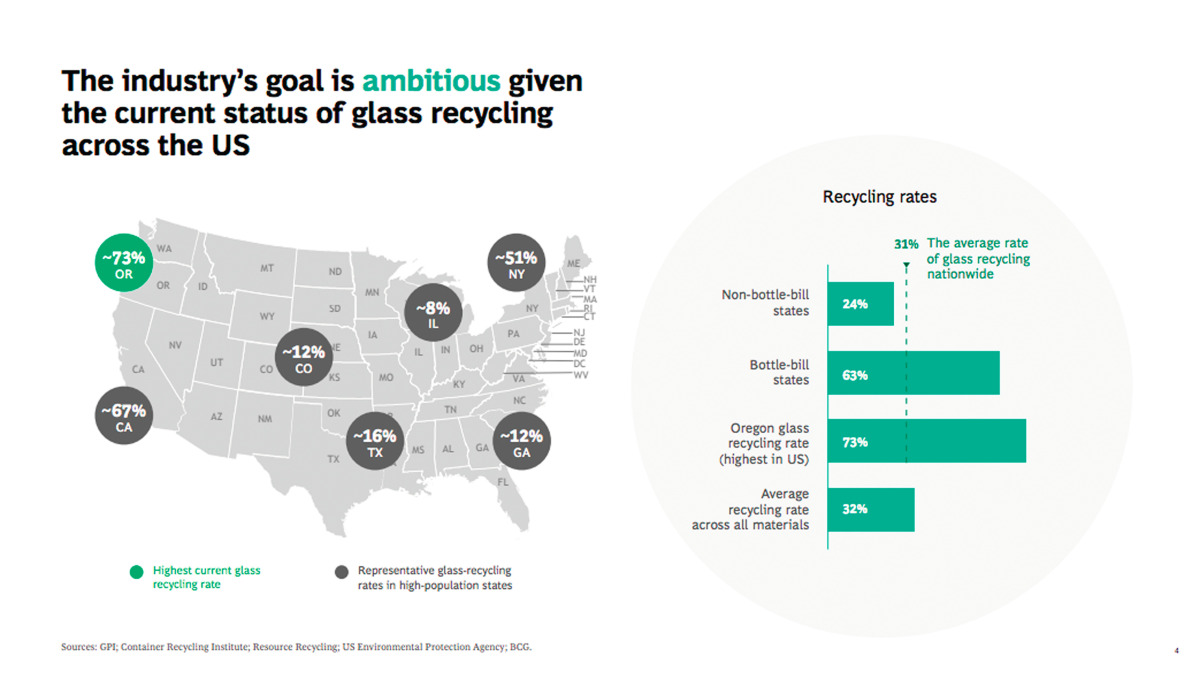
In the USA, according to the figures from USA’s Environment Protection Agency (US EPA), recycling rates still lag far behind the recycling rates in Europe. According to these figures, the recycling rates have tended to fall in recent years and stood most recently at just 25 % in 2018 (Fig. 10). For glass bottles, the recycling percentage is reported to reach at 31.3 %. Around 60 % of the generated used container glass quantities are still sent to landfills, almost 10 % go to waste incineration plants. The goal of the US authorities to achieve a recycling rate of 50 % for container glass has not been reached for years. In those US states where a bottle deposit (BottleBill) has been introduced in the USA, recycling rates are considerably higher (Fig. 11). However, this has been introduced in just ten of the 50 states. Especially in the Midwest of the USA, only limited efforts have been made to move away from the throwaway society.
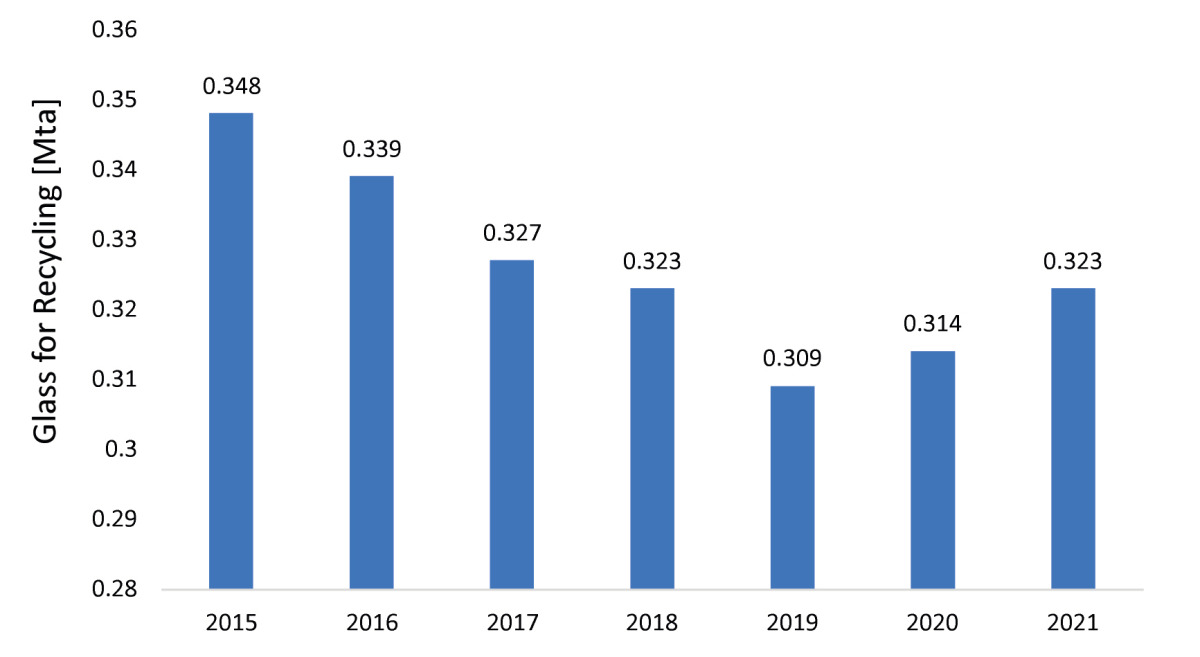
In Japan, the opposite is the case. It is true that container glass quantities for recycling have been on the decline since 2005 when quantities of over 0.5 Mta were processed (Fig. 12). Currently, however, the quantities still reach a good 0.3 Mta. Fact are sustained high “bottle-to-bottle” (BtB) recycling rates – especially for clear glass with 98.1 % and brown glass with 99.5 %, the country is at the top end of the rankings. Only for BtB recycling of other coloured glass does the country come off badly with 23.8 %. In total, for 2021, the country reached 66.7% BtB, the rest being melted down for downcycling. In 2021, the following cost structure resulted for container glass: clear glass 13.3 US$/t, brown glass 15.1 US$/t and other coloured glass 26.2 US$/t.
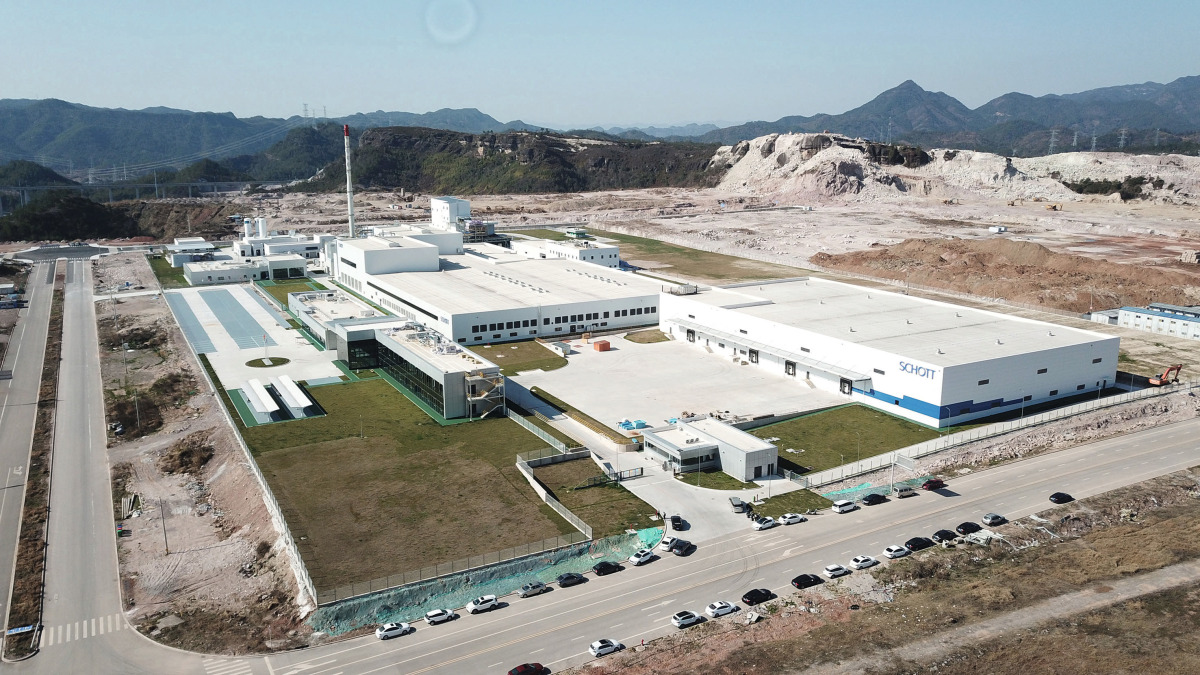
Container glass companies are making further investments. This not only concerns bottles and glasses for the beverages and food industry, but also vials, flacons and other container glass, for example, for the pharmaceuticals and cosmetics industries. The Schott Group, for instance, started up operation at a new factory for glass vials in China in 2021 with an annual capacity of 20 000 t (Fig. 13). Verallia, the leading European and worldwide third largest manufacturer of container glass for foods and beverages, has announced the construction of two more glass melting furnaces in Spain and Italy for the years 2025/26. Recycling of glass cullet is playing a part in all these projects because the companies have in the meantime set themselves ambitious climate protection goals and CO2 can be avoided by recycling. For instance, Schott wants to achieve climate neutrality already by 2030.
4 Flat glass
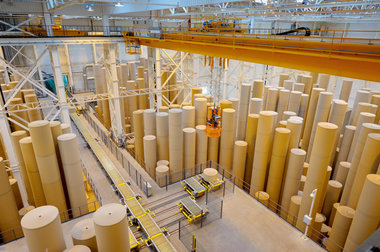
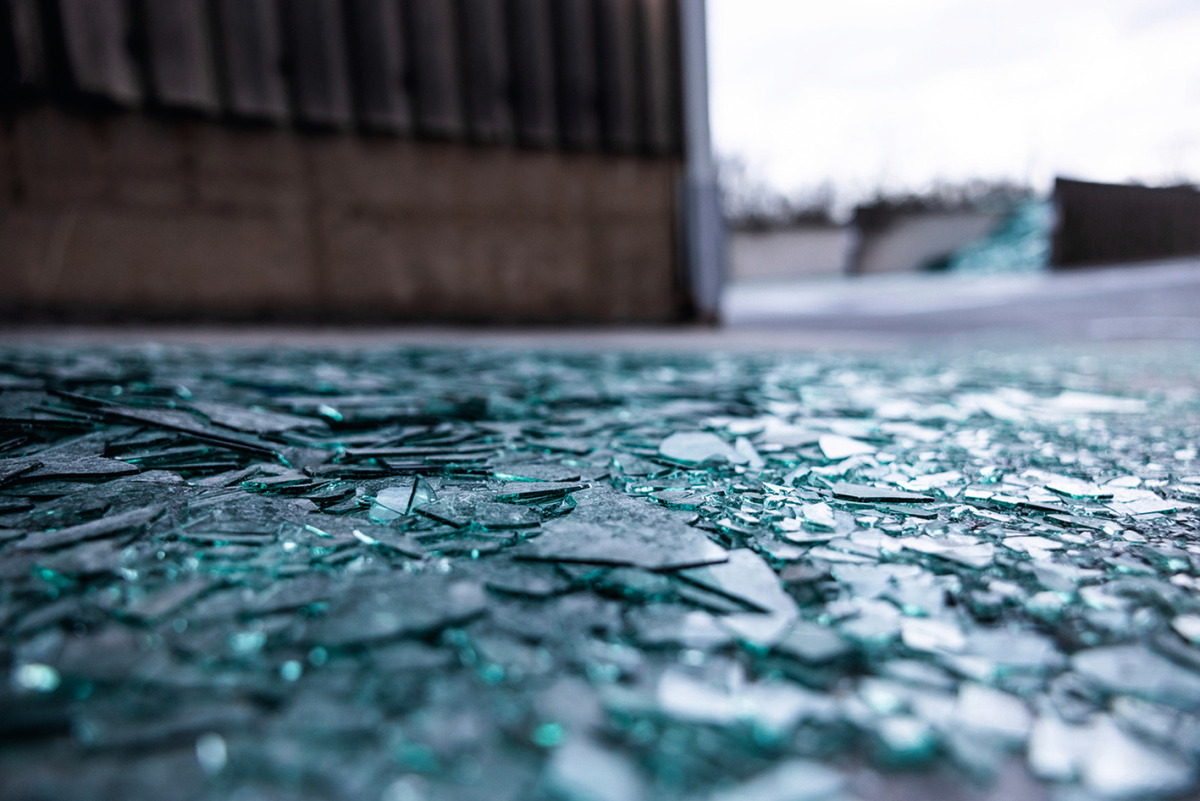
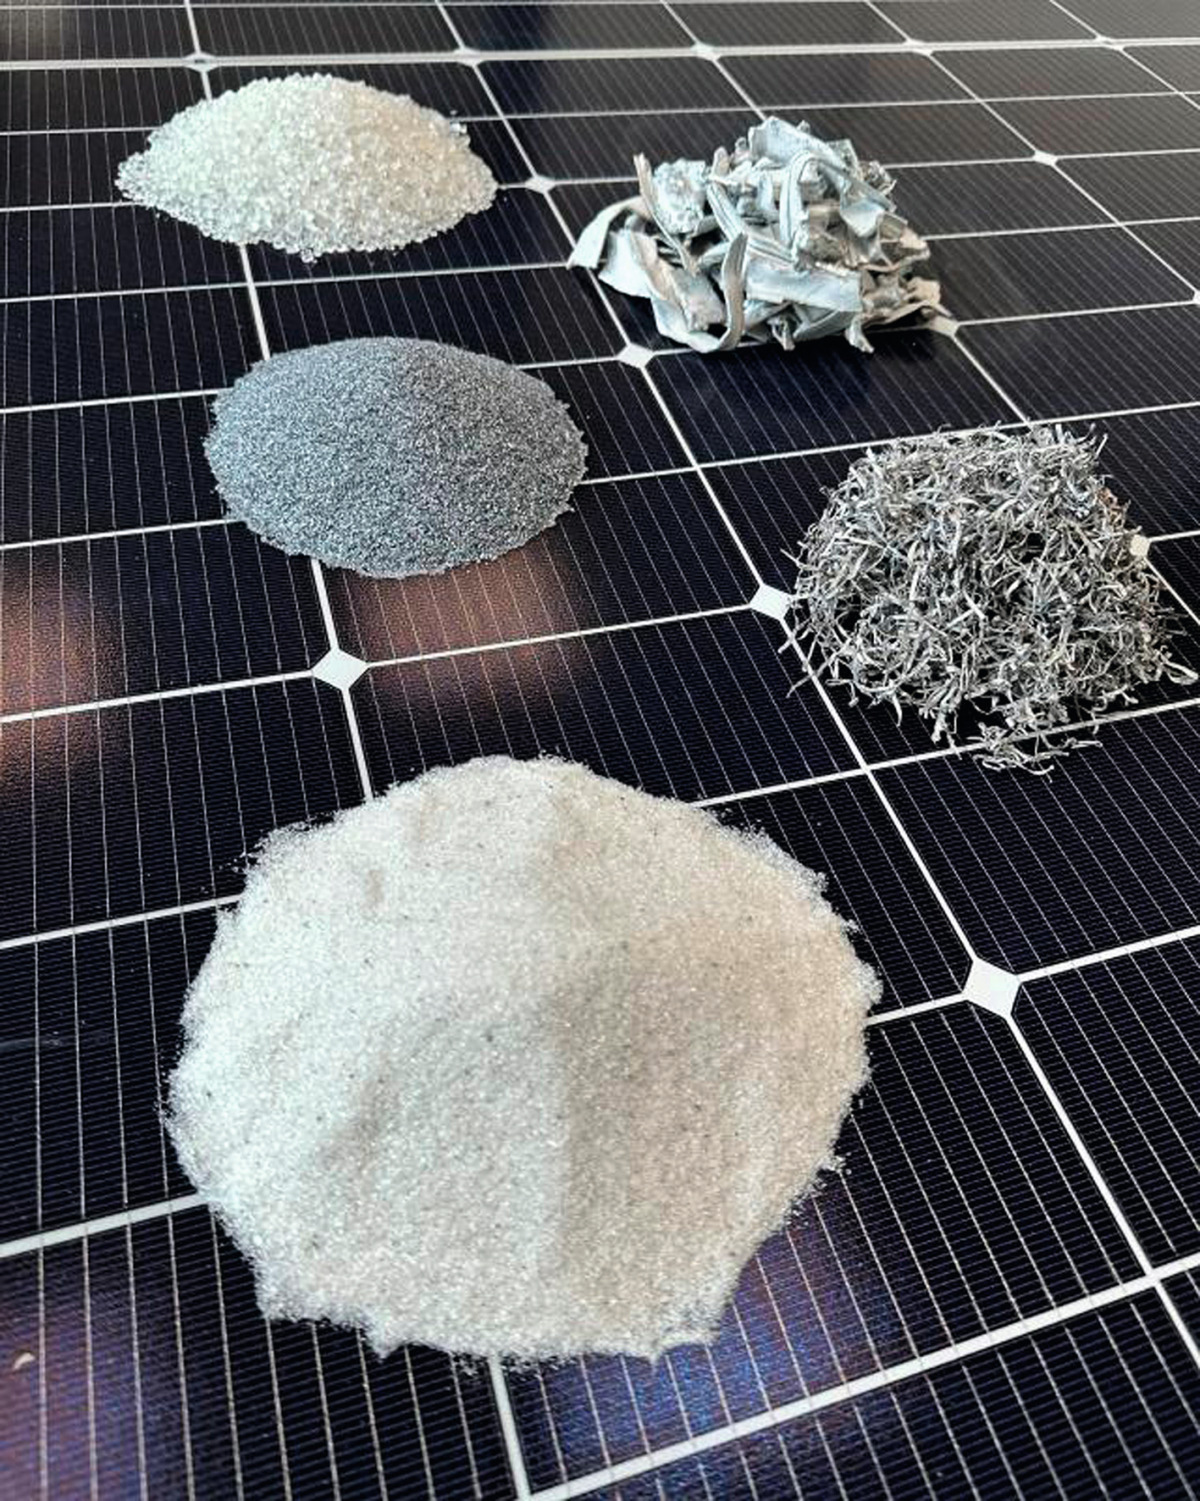
Compared to the recycling of container glass, flat glass has so far had only minor importance. Flat glass cullet (Fig. 14) is produced everywhere work is done with flat glass products (e.g. in glazing companies, at window manufacturers, during building demolition and in car workshops). An extensive collection, processing and recycling network for this waste glass so far exists almost only in those countries where flat glass is also manufactured [5]. The purity of the collected waste glass is crucial for the quality of the recyclate. A differentiation is made between two sorting criteria: clear float glass cullet which can be remelted without processing and flat gas cullet that must first undergo processing. If no recycling is possible for the waste glass, other useful downcycling options are available.
Recycling rates for flat glass are practically not published at all. If figures are given, these fluctuate between 0 % and 100 % depending on the source. To correctly assess such figures, it is helpful to understand the definitions. In-factory reject or cutting waste that does not leave the factory but remelted, is not recycling. Flat glass cullet from post-consumer usage that is recycled to make container glass, glass wool or glass blocks is also not recycling, but downcycling. The lines become more blurred, however, for the so-called “pre-consumer” glass. For its ORAÉ flat glass, Saint-Gobain claims that more than 64 % external glass cullet is used in its production. Less than 1 % of this comes from post-consumer glass cullet, 64 % comes from the pre-consumer sector, including unmixed glass cullet from the company’s own further processing operations [4].
Saint-Gobain, which generated sales of € 51.2 bill. in 2022 has set itself the goal of saving 30 % raw materials by 2030 with a higher recycling percentage. By 2040, 40 % glass cullet is to be used in production, half of this being post-consumer material. The company aims to achieve climate neutrality by 2050. In Aniche/France, the company says it started operation at the world’s first climate-neutral flat glass production (Fig. 15). There 100 % recycled glass cullet is used. The energy used comes from biogas and climate-neutral electricity. To achieve its recycling goals, Saint-Gobain has gone into partnership with glass recycling companies, like, for example, the Swedish Ragn Sells Group.
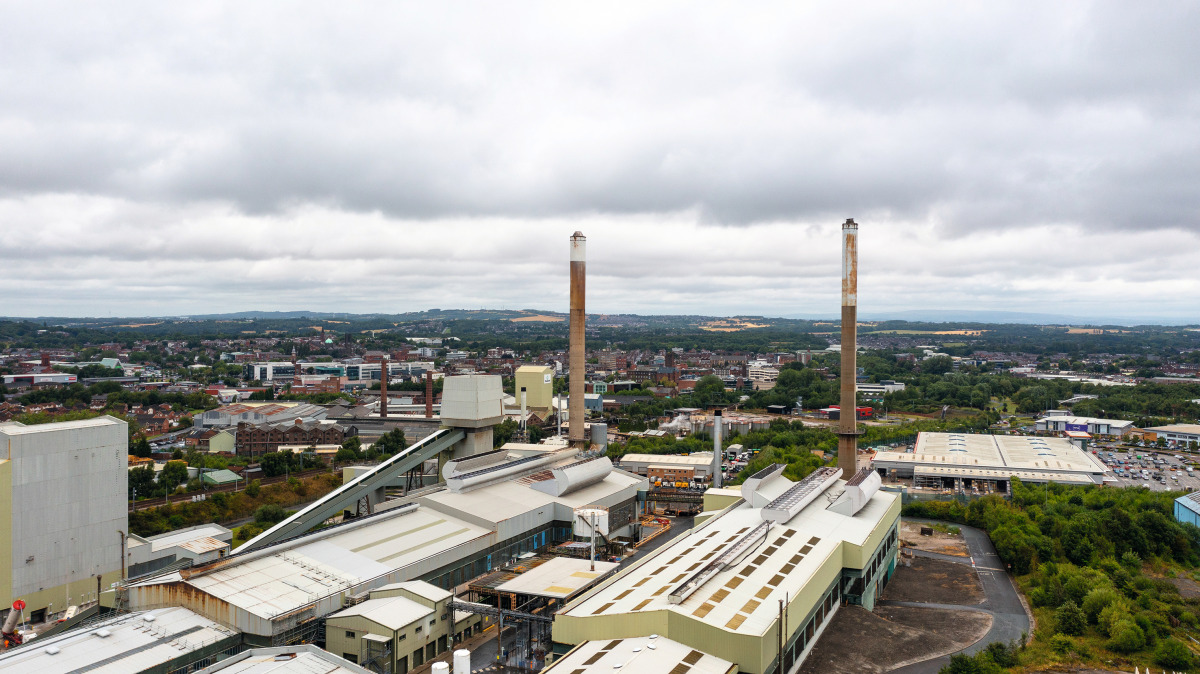
The goals of the other major flat glass manufacturers do not differ essentially. Pilkington, which is part of the Japanese NSG Group, also wants to achieve climate neutrality by 2050. The recycled percentages of the materials used directly and indirectly for flat glass production are to be increased considerably with the use of 20 % waste glass that has so far gone to landfill. The company is upgrading its Greengate glass melting furnace in Merseyside (Fig. 16)/England, so that rolled glass for the automotive industry and float glass for buildings can be manufactured there simultaneously. The glass melting furnace at the Watson Street site will then no longer be necessary, which will cut around 15 000 t CO2 emissions per year. The project started in August 2023 and is scheduled for completion in August next year.
Guardian Glass, which produces flat glass for a range of different applications, operates a total of 24 float glass plants. According to details released by the company, these produce a total of 500 km flat glass daily. In its environmental protection declarations for flat glass from the year 2021 for the sites in Europe and Russia, average recycled contents of 19.0 % for flat glass and 17.4 % for laminated safety glass are specified. Guardian is known for a string of glass innovations to keep homes and buildings comfortably warm or cool as needed (Fig. 17). For instance, it has come up with metal oxide coatings with high solar gain for the cold northern climate zones as well as other coatings with solar protection and low solar heating for hotter southern climate zones. In addition, glass is produced for touchscreens.
5 Glass recycling plants
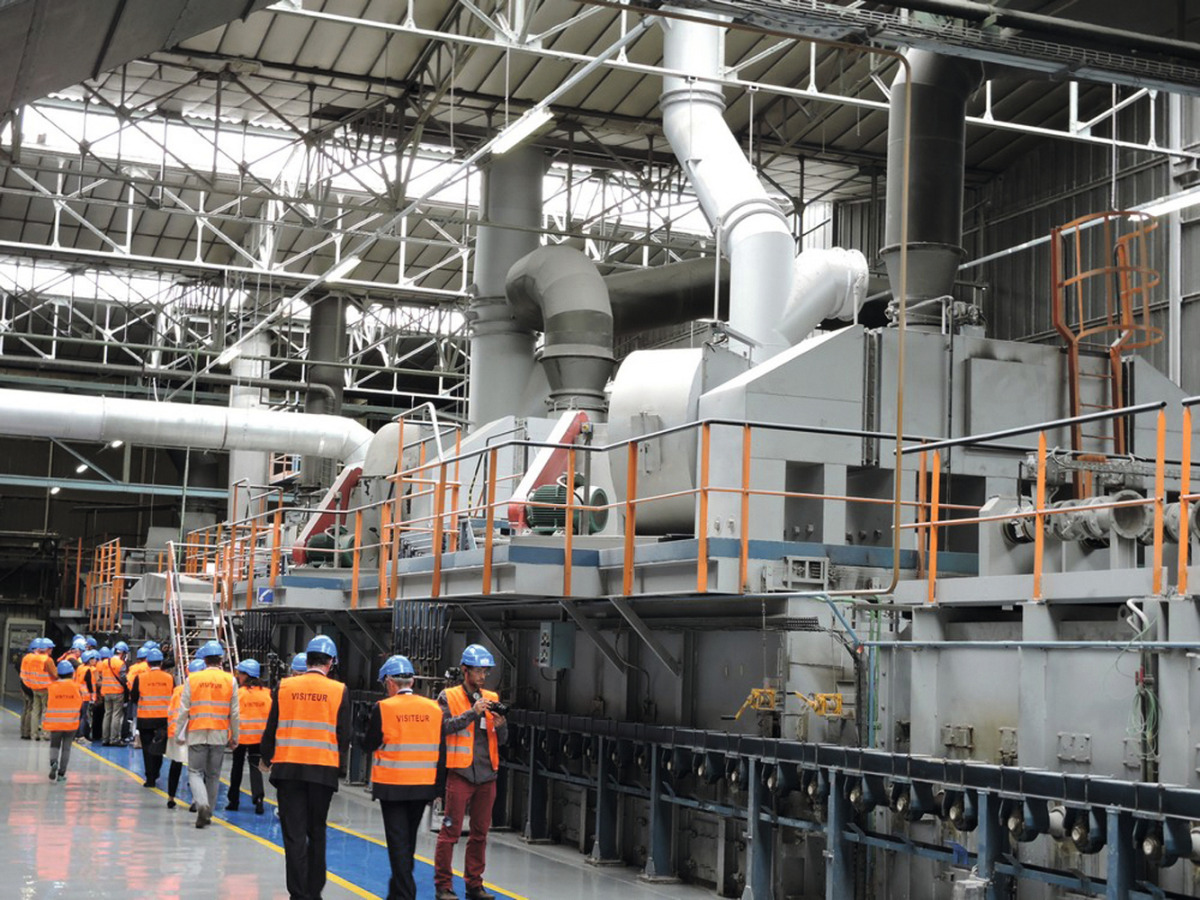
The number of glass recycling plants around the world has increased sharply in recent years. On the one hand, this is because legislators are demanding higher recycling rates in different countries, and an increasing separation of the different glass types and therefore a specialization of the glass recycling plants is taking place (Fig. 18). However, there are also countries like Japan where the market is largely saturated and an extensive network of plants exists. There, a trend towards a concentration of the market can be established. In Japan, for example, the number of glass recycling companies fell from 85 in 2005 to 49 in 2021. ENF Recycling makes available a worldwide overview of recycling plants. The numbers there are certainly not complete, but they can provide a rough guide to how many plants exist in the individual countries and which are the glass recycling companies.
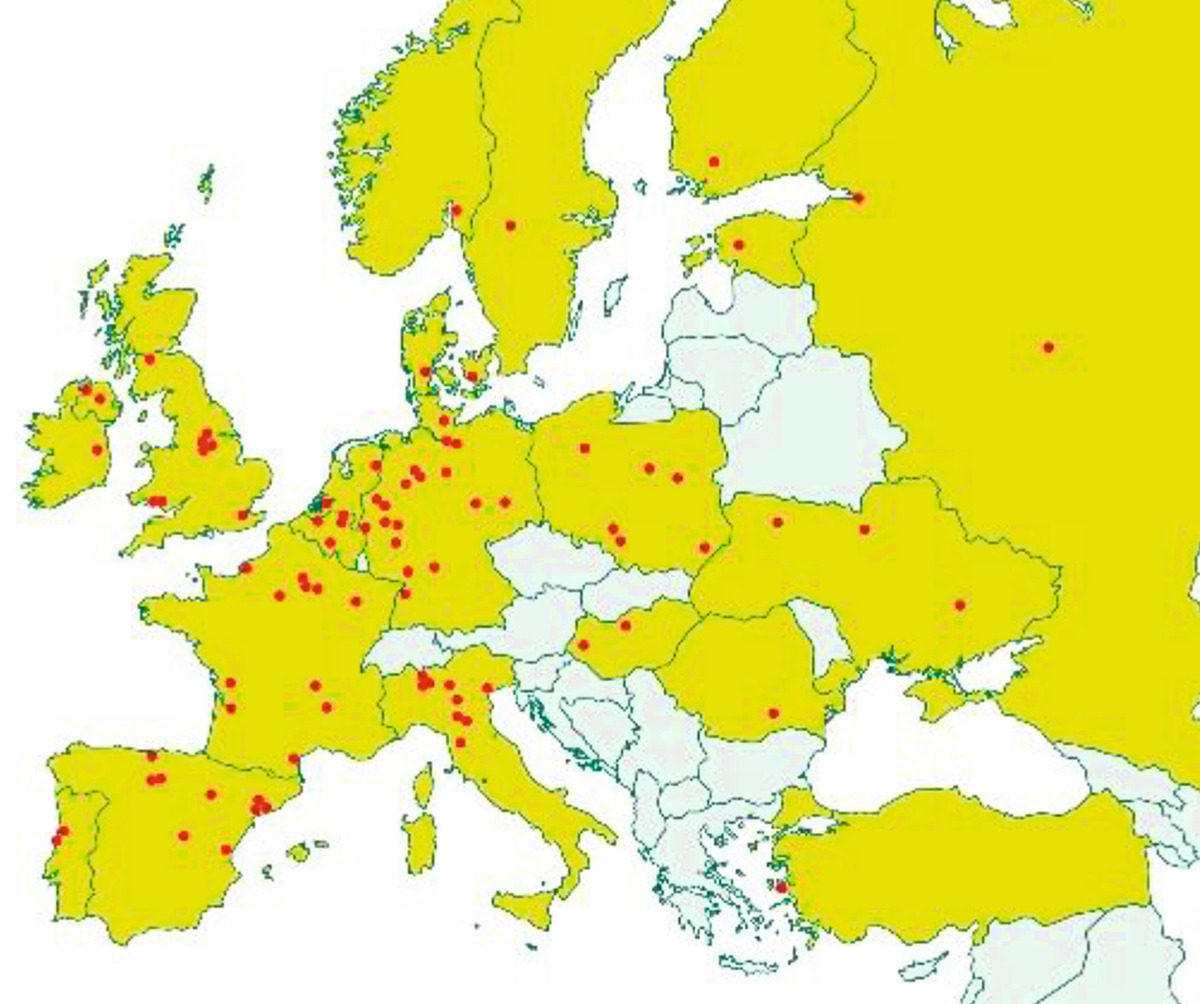
For Europe, figures are provided by FERVER, the European Federation of Glass Recyclers. Its member companies are responsible for 70 % of glass recycling in Europe. In 2020, it had a total of 44 member companies in 20 countries with 88 recycling plants and 2350 employees (Fig. 19). In 2016, the number of recycling plants operated by the federation’s companies still stood at 70 plants. Most of these plants are located in Germany (18), France (11), Italy and Spain (each 9). In the Scandinavian countries, the market is relatively small and, besides Denmark with two plants, there is only one plant in each of the other countries. In Great Britain, there is a total of six plants.
6 Market outlook
With a current production output of 181 Mta glass, we expect around 30 Mta recycling input, with another 17 Mta being downcycled. Accordingly, only a quantity of 26.2 % is reused and 16.6 % recycled in a closed loop. For container glass, with an estimated 37 %, the highest recycling rates (incl. downcycling input) are achieved, for flat glass, recycling rates of only around 18 % are reached. The market for all areas – from glass collection through waste glass processing and glass recycling – is booming. Despite ever higher legislative goals to promote a circular economy, the growth rates in the industrialized countries have become considerably weaker again. High double-figure growth rates are achieved only in several threshold countries in Asia, Latin America and Africa.