Insights into the circular economy
 Credit/Quelle: Singkham/Thailand
 Credit/Quelle: OneStone Consulting
 Credit/Quelle: Circle Economy
 Credit/Quelle: Circle Economy, OneStone Consulting
 Credit/Quelle: Circle Economy
 Credit/Quelle: Eurostat, OneStone Consulting
 Credit/Quelle: Eurostat
 Credit/Quelle: Eurostat
 Credit/Quelle: Swiss Recycling
 Credit/Quelle: CEPI
 Credit/Quelle: UPM
 Credit/Quelle: FEVE
 Credit/Quelle: OneStone Consulting
 Credit/Quelle: Plastics Europe
 Credit/Quelle: DSD
 Credit/Quelle: DSV
 Credit/Quelle: World Aluminium
 Credit/Quelle: UEPG
 Credit/Quelle: Metso
 Credit/Quelle: Ecoba
Are we already close to achieving a circular economy or are we still far from it? This question is not easy to answer. On a global scale, we may be more distant than ever, but major progress has already been made in certain economic sectors, countries or regions. The following report provides current data and trends.
1 Introduction
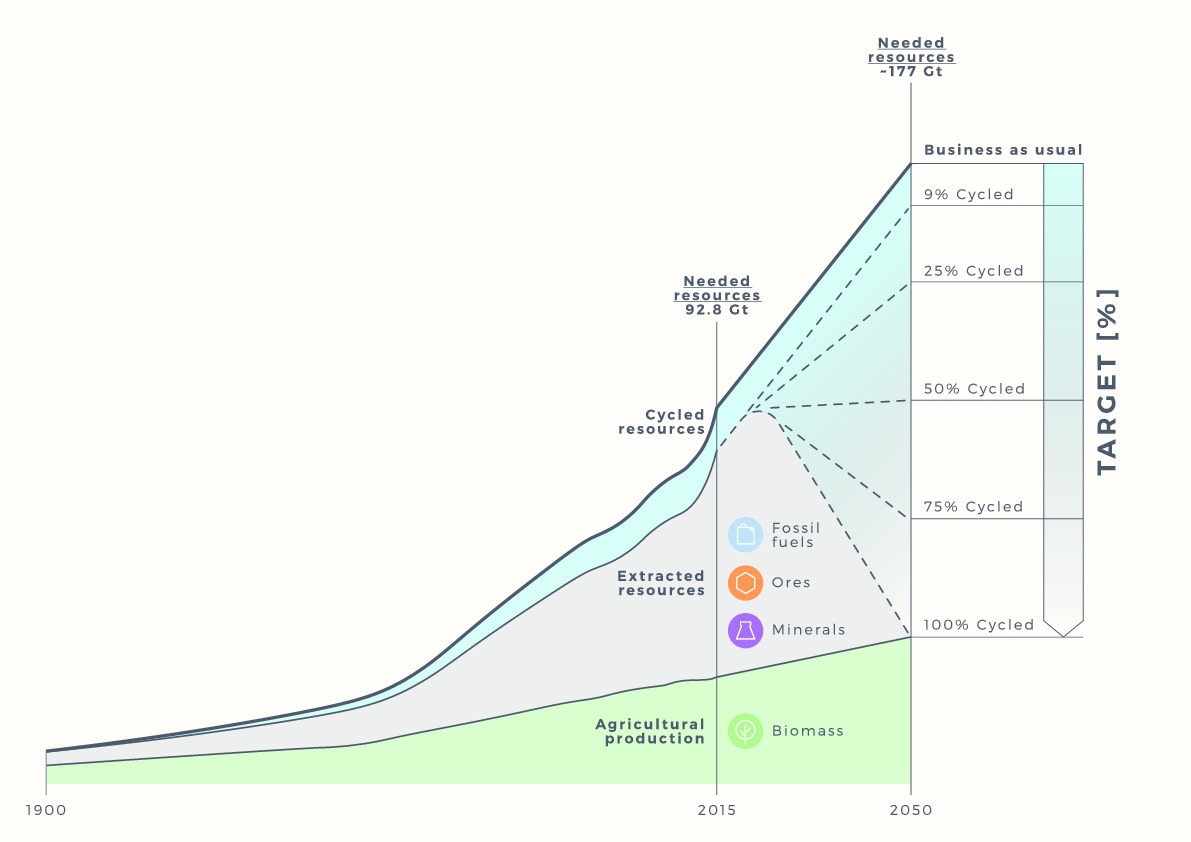
The circular economy is an alternative model to the linear economy and is sustainable. The model is quite simple in theory (Fig. 1), but difficult to put into actual practice. The model assumes that available resources are used and reused for as long as possible, as the resources are finite. Accordingly, it is necessary to reduce the waste streams, so that the amount of new resources consumed is restricted to the amount actually necessary for growth. The problem today is that many resources are only used for a short time, or they are lost to the circular economy because they are disposed of in landfills or in the environment, or are converted into inferior materials or burned. Improving resource efficiency is therefore an important component of sustainable development.
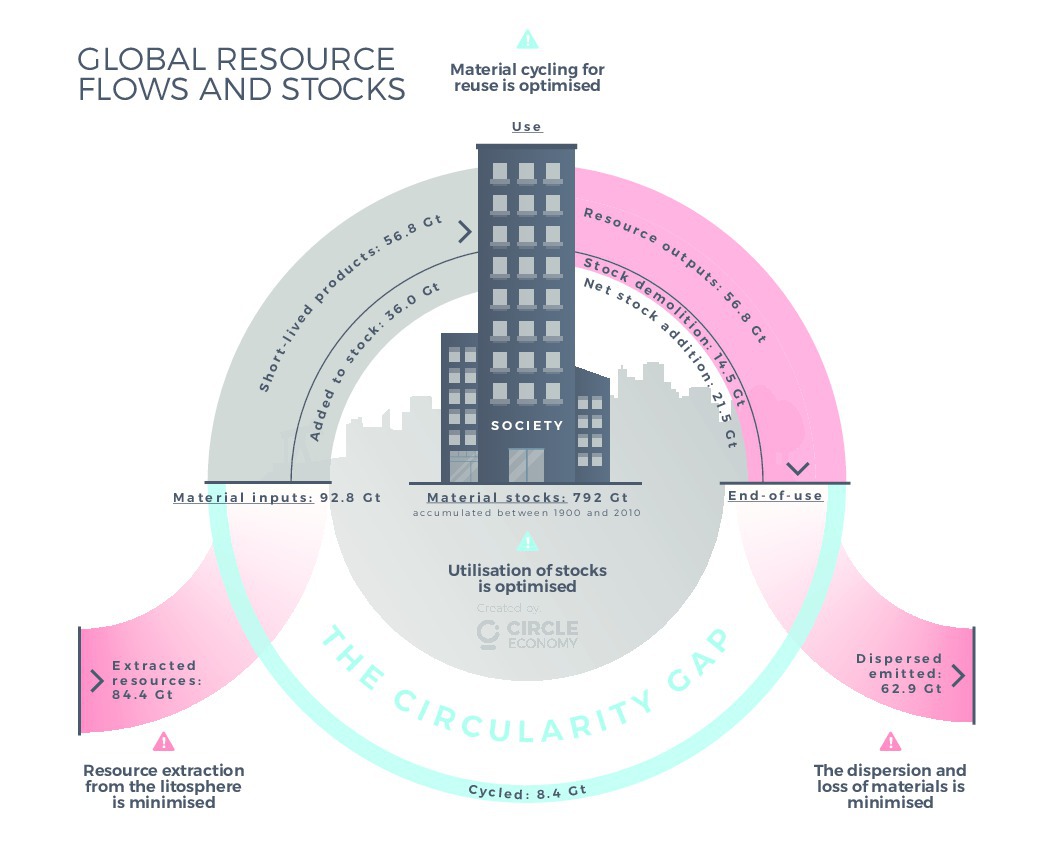
In 2019, the co-operative ‘Circle Economy’ in Amsterdam published its second report entitled „The Circularity Gap“ [1]. It concludes that only 9.1 % of the world‘s resources are re-used annually, which is a very poor result. Fig. 2 illustrates the quantities involved. In 2015, a total of 84.4 billion tonnes (Gt) of natural resources from the minerals, ores, fuels and biomass sectors, as well as 8.4 Gt of recycled materials were used worldwide. Out of this total amount of 92.8 Gt, 36.0 Gt go into the material stocks (buildings, machinery, facilities, etc.), while 14.5 Gt are removed from the material stocks (building demolition, etc.). The largest amount of 51.9 Gt of resources is consumed (energy production, fuels, etc.), while 19.4 Gt are waste.
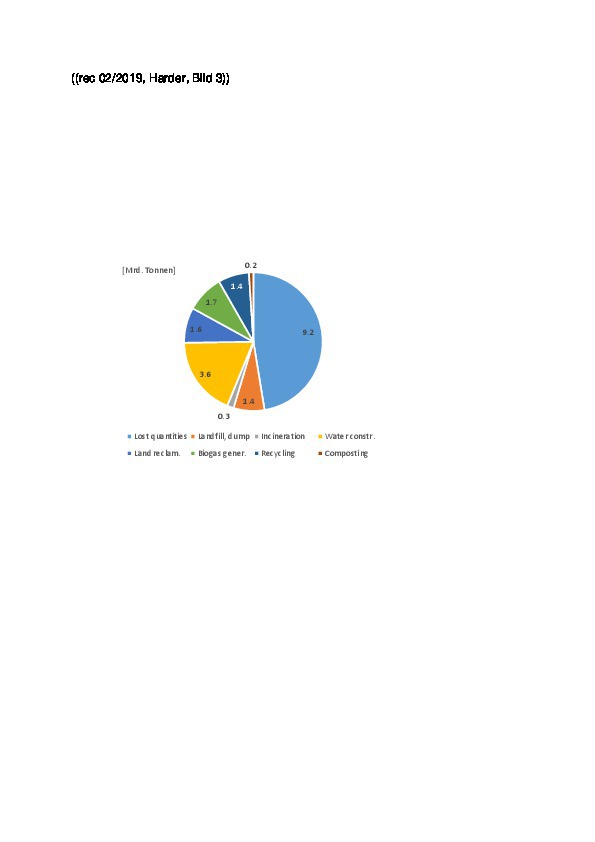
Of the 19.4 Gt of waste, an estimated 9.2 Gt are lost, 1.4 Gt go into landfills, 3.6 Gt are used in water construction (hydraulic engineering) and 1.6 Gt for landfilling (Fig. 3). However, only 1.4 Gt are actually recycled as a resource for new products, while 0.3 Gt are burned, 1.7 Gt are used for biogas production and 0.2 Gt are composted. The amount of resources reused, not including incineration, amounts to 8.4 Gt. At the figure of 92.8 Gt for resources used worldwide, this equates to a global reusage rate of 9.1 %. In Europe the reusage rate is 12 %, but in China it is only 2 %. Although it is estimated that China exploits only 16.5 % of the world‘s resources, including imports, this figure does appear much too small.
For the year 2050, Circle Economy estimates that 177 Gt of resources will be used by the world‘s human population, provided that a 9 % recycling rate is maintained. That represents almost twice today‘s quantity (Fig. 4). This forecast is based on the premise that the world population will increase by 2.3 billion to 9.8 billion with a significant growth of the middle class. If, on the other hand, we do not want to use more resources than we do today, a recycling rate of more than 50 % would be necessary in 2050. The EU, for example, wants to achieve a recycling rate of 65 % in its waste management by 2050 [2]. Today, however, its waste recycling figure is only about 30 %.
2 EU waste management
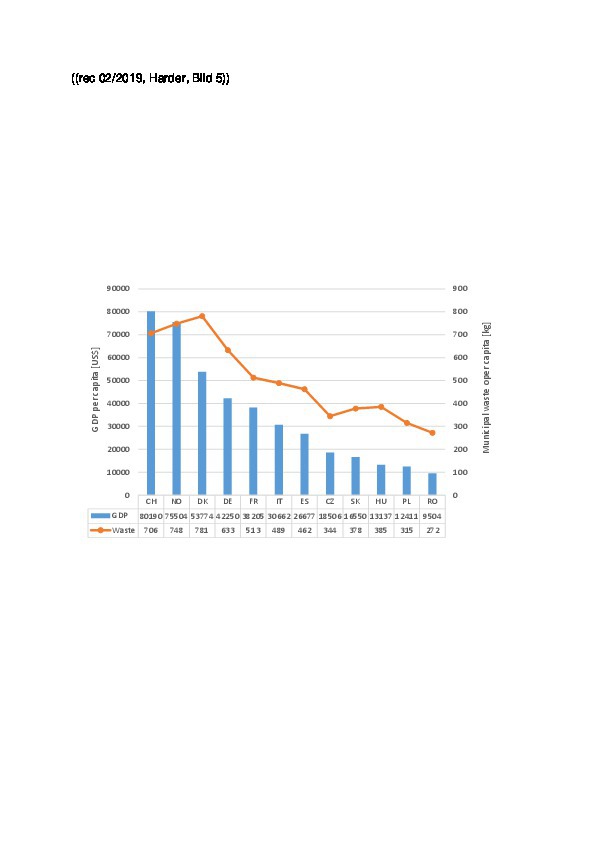
Landscapes without piles of rubbish, an environment that is as intact and unpolluted as possible, and clean water are what we aspire to. But at the same time, our income and therefore our standard of living has risen, and as a result of the global economy with ever shorter product life cycles, we live in a throwaway society rather than in a circular economy. Fig. 5 shows a correlation of per capita waste volumes and gross national product in Europe. In 2017, the average GNP in the EU was US$ 32 462 per capita and the specific amount of waste per capita was 486 kg. High GNP countries such as Norway, Switzerland, Luxembourg, Denmark and Germany also produce the largest amounts of waste, while countries such as Hungary, Slovakia, the Czech Republic, Poland and Romania have the lowest specific amounts of waste.
Fig. 6 illustrates the size of the absolute waste and recycling volumes in the most important EU countries in terms of municipal waste generated in 2017. Germany is the leading country, both in terms of waste volumes and recycling quantities, with a recycling rate of 49.1 %. It should, however, be mentioned that waste to energy is also included in the calculation. Belgium and Sweden also have relatively high recycling rates of 33.9 % and 31.3 % respectively. They are followed by Italy (27.8 %), Poland (26.7 %), the Netherlands (25.9 %), Austria (25.8 %) and France (23.9 %). Romania has a very low recycling rate, but recycling could also be greatly increased in Spain, Greece and Portugal, based on their average of 30 %. By 2025, the EU is aiming for an average rate of 55 %, and by 2030 the target is 60 %.
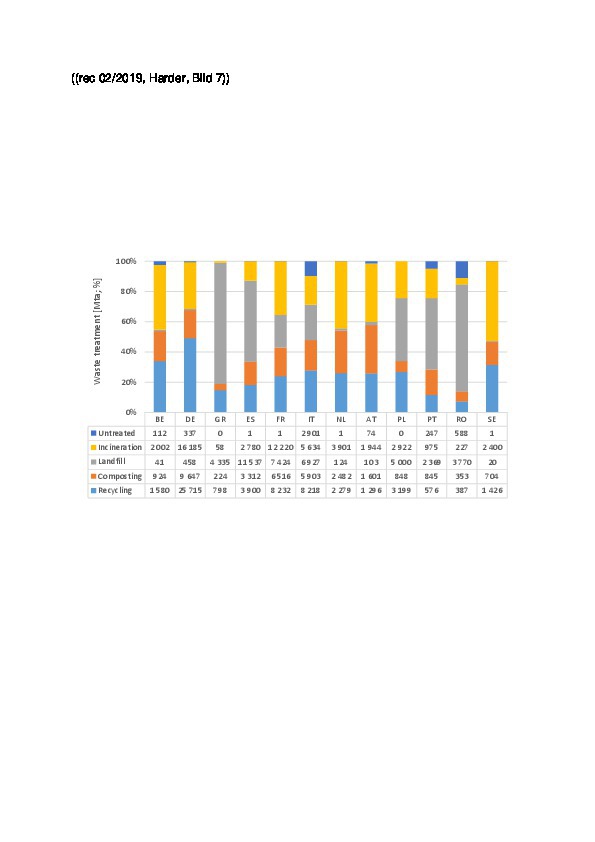
In order to fulfill its pioneering role, the EU must first and foremost curb the landfilling of municipal waste and invest in recycling technologies and facilities in the countries concerned. Fig. 7 shows the municipal waste volumes of the above-mentioned countries, broken down in accordance with type of treatment. Particularly striking are the large landfill ratios in countries such as Greece, Romania, Poland and Portugal, as well as the landfill ratios in Spain, France and Italy. The quantities of untreated waste in Italy, Romania and Portugal are also alarming. One can probably assume that these quantities represent illegal landfills. The actual recycling volumes are at a comparatively low level.
3 Functioning circular economy
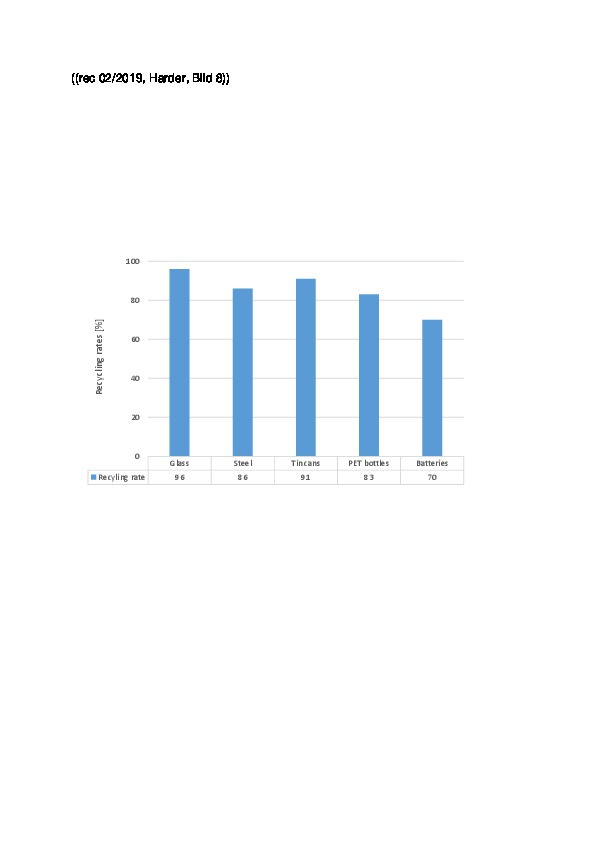
In general, it can be stated that, given the recycling rate of 9 %, the world is still far from a circular economy. However, there are also some positive examples of functioning solutions and structures. These usually have to do with the fact that either the landfill costs are extremely high, or that the waste has a relatively high sales value. In our view, Switzerland is world champion in recycling (Fig. 8). The highest recycling rates are achieved for reusable materials. In Switzerland, 160 kg of paper are collected per person per year. 1.3 million t of organic waste is composted, 128 kt of electronic scrap is recycled, as is 60 kt of textiles and shoes. In Switzerland, no more landfilling takes place, 50 % of municipal waste is recycled and 50 % is burned or used for energy generation.
According to the German Association of Secondary Raw Materials and Waste Management, the circular economy in Germany currently generates sales of around € 76 billion (+ 1.1 % p.a.) and employs more than 290 000 people (+ 0.8 % p.a.). As many people are now employed in the German circular economy as in the energy industry and almost four times as many people as in the water and wastewater management sector. With a gross value added of around € 21.5 billion (+ 3.4 % p.a.), the industry has become an important economic factor. The onward development of specializations and improved standards for waste recycling, as well as the necessary development of suitable technologies, provide the basis for a dynamic development of the entire industry.
3.1 Paper recycling
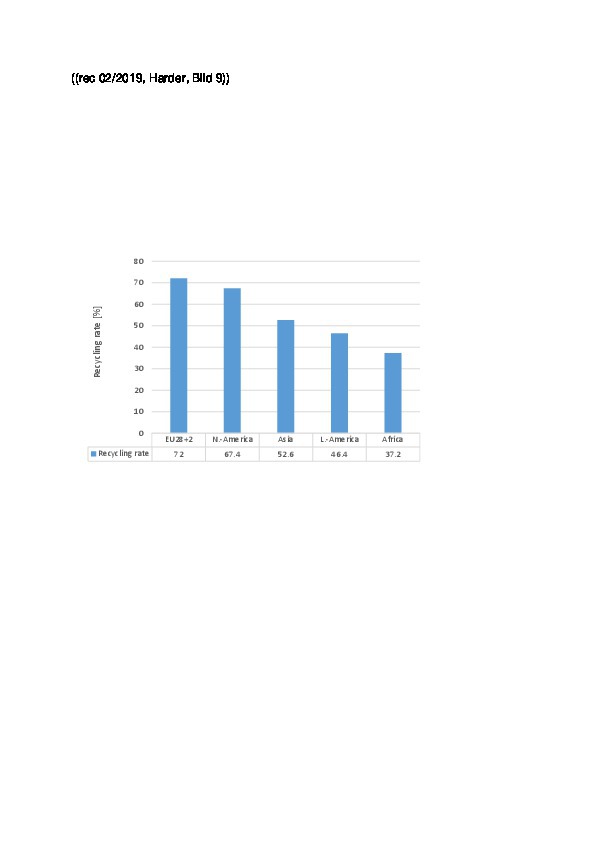
The global production of paper and cardboard decreased by 0.8 % in 2018, while recycling rates increased significantly, a situation which displays the main features of a circular economy. In Europe, the recycling rates for recovered paper have risen from 40 % in 1991 to 72.3 % in 2017. This development has given Europe the leading role worldwide. Fig. 9 shows the recovery rates for recovered paper in 2016 by regions of the world. The EU 28+2 (including N and CH) achieves a figure of 72 %, with 17 European countries having a recycling rate above 70 % and 9 countries having a rate below 60 %. Asia including China has a rate of 52.6 %, while Africa currently only achieves recovery rates below 40 %. The average global recycling rate in 2016 according to CEPI (Association of the European Paper Industry) was 58.4 %. The new recycling targets in Europe foresee recovery rates of 75 % in 2025 and 85 % by 2030.
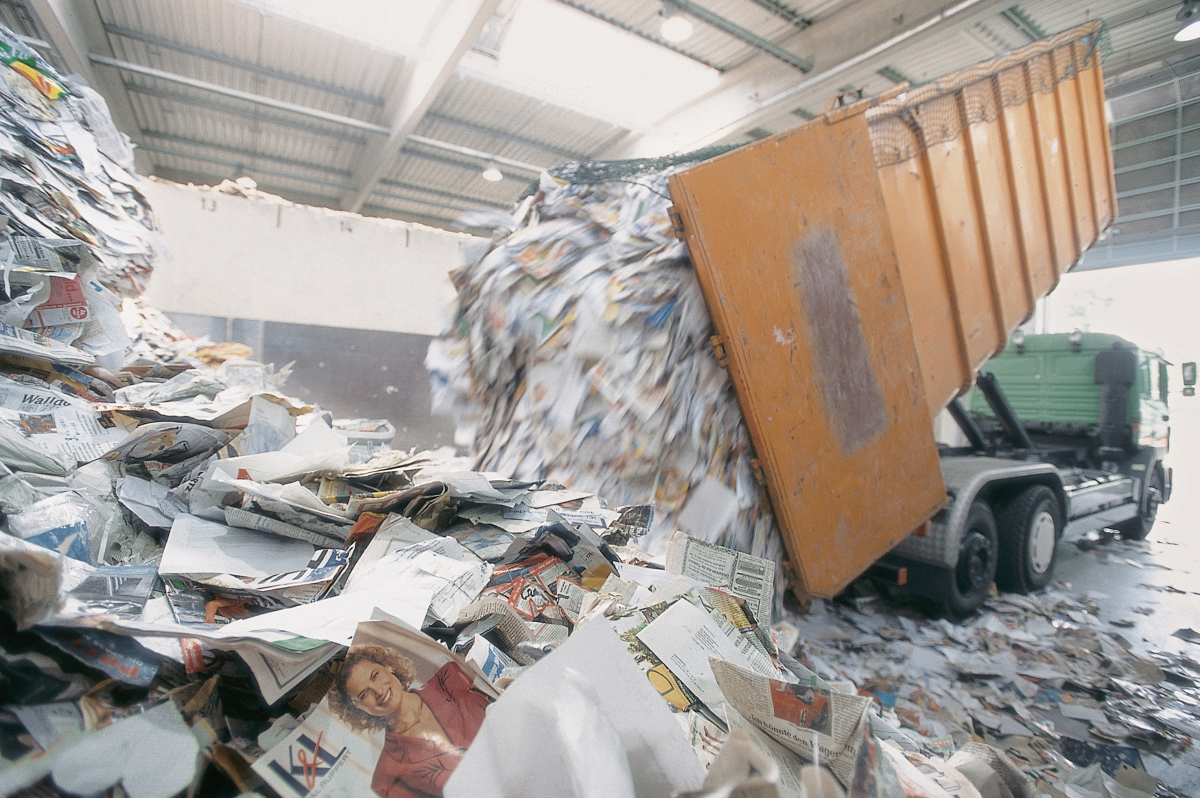
The economic and environmental benefits of recovered paper recycling are considerable. Instead of 50 liters of water and about 5 kWh of energy for the conventional production from wood fibres, only 50 % of the energy and about 33 % of the water are needed for processing the recovered paper. For 1 kg of recycled paper 1.2 kg of recovered paper is needed. Per kg of secondary fibre paper, up to 2.2 kg of wood fibre are saved. However, recovered paper must be decolourized (deinked) before recycling, i.e. the printing ink has to be removed (Fig. 10). Deinking requires the use of a number of chemicals, as well as energy. Theoretically, a paper fibre can be recycled five to seven times. The unavoidable loss of fibres during the papermaking process is compensated by adding fresh fibres.
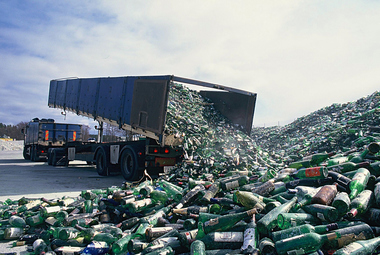
3.2 Glass recycling
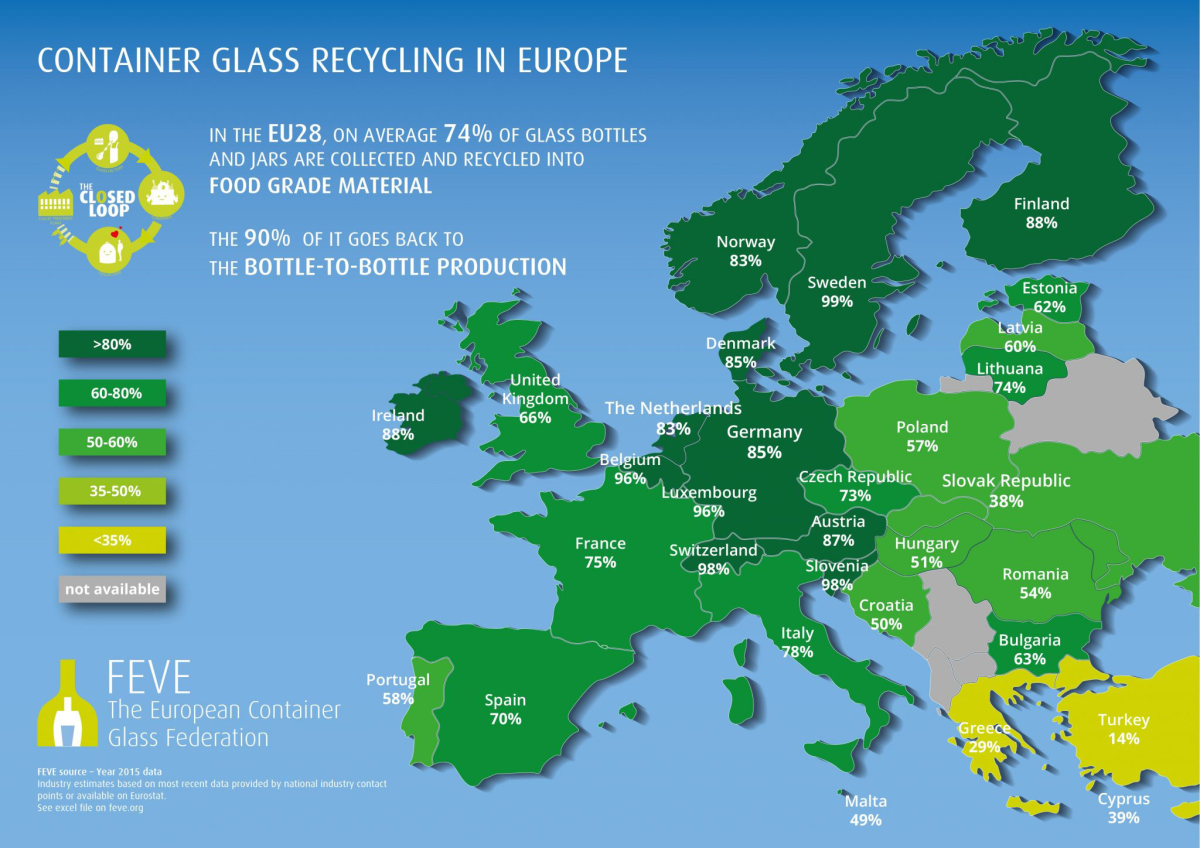
Worldwide, about 130 million tons (Mta) of glass are currently produced annually. The largest volumes of 63 Mta or 48 % are accounted for by hollow or container glass, while 54 Mta or 42 % are accounted for by the various flat glass products (construction and window glass, car glass, etc.). The global recycling volumes are currently estimated to be around 27 Mta, thus accounting for only 21 % of the volume of glass produced. The highest recycling volumes are achieved for container glass, with an estimated 32 %, while recycling rates of only 11 % are achieved for flat glass [2]. In Europe (EU 28), the glass recycling rate for container glass has been stable for years at 74 %, but there is a pronounced north-south divide (Fig. 11). More than 11.6 Mta of glass bottles were recycled in 2015 according to data from the European Container Glass Federation (FEVE) [3]. In the USA, the proportion of recycled glass in container glass production increased from around 25 % in 2008 to 33.6 % in 2013. Currently, it is estimated at around 35 %.
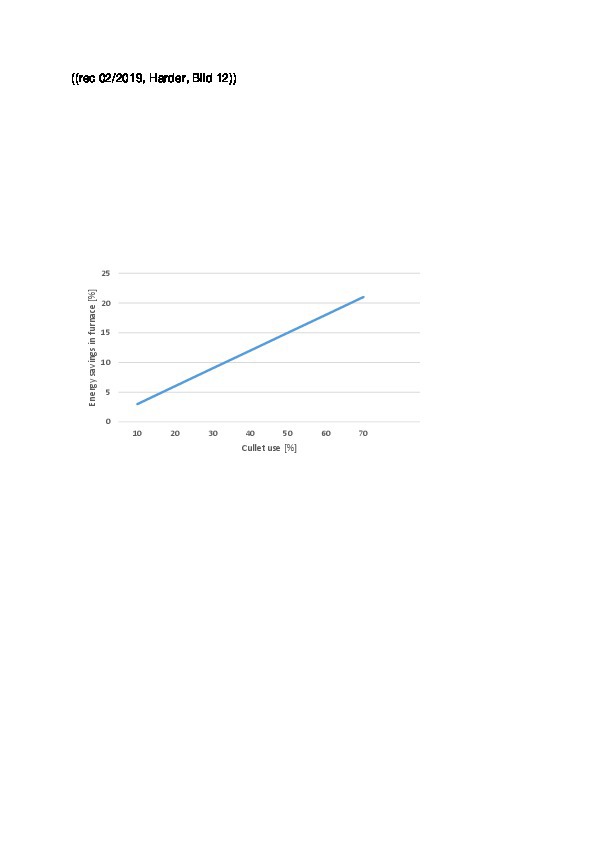
Glass recycling is subject to economic framework conditions. It should be noted that the energy consumption of the glass production process decreases by about 3 % when 10 % of the natural raw materials are replaced by recycled glass (Fig. 12). Accordingly, when using 65 % of recycled glass cullets, a 20 % energy saving can be achieved. Melting vats in glassworks can use different proportions of recycled glass cullets, depending on the quality of colour separation. The proportion of recycled glass in the production of green glass is 90 %, in some cases also reaching values of 95 %. In the case of brown glass the proportion is 70 %, while white glass production generally only permits a proportion of 60 %. However, the price of the recycled glass is the determining factor for the quantities used.
3.3 Plastics recycling
Worldwide plastic production (excluding PET and PA fibers) increased by almost 4 % to 348 Mta in 2017. Europe has a share of 18.5 % in this production quantity and accounts for 60.4 Mta (+ 7 %), while China now has a share of 29.4 % in the global figure. The rest of Asia, including Japan, accounts for 20.7 %, while the NAFTA countries have a share of 17.7 %. Africa and the Middle East have a 7.1 % share, Latin America 4 % and the CIS 2.6 %. Regrettably, there are no reliable market data for the global recycling quantities [4; 5]. In Europe (EU 28+2), a total of 27.1 Mta of plastic waste was collected in 2016 (Fig. 13). Of this quantity, 41.6 % (11.3 Mta) was used for energy, while 31.1 % was recycled, with the largest volume coming from plastic packaging. 7.4 Mta were used for landfilling. In the case of plastic packaging, most countries in Europe achieve recovery rates above 35 %. Germany achieves 50 %, with a small proportion of the waste being used as a feedstock for new plastic products.
Germany is the pioneer in national recycling legislation. In 1990, the dual system for collecting and recycling sales packaging was introduced in anticipation of the Packaging Ordinance and statutory producer responsibility. This is generally seen as a paradigm shift from the throwaway to the circular economy. In 2003, the system was changed from a monopoly to a competitive market. Since 2015, plastic waste has to be collected separately in Germany. The Kreislaufwirtschaftsgesetz (KrWG), the law governing recycling management and waste, states that as from 2020 at least 65 % by weight of the total municipal waste has to be reprocessed or recycled (Fig. 14). For plastic packaging, the Packaging Ordinance stipulates that at least 60 % has to be recycled, and that in turn 60 % of that material has to be reprocessed into new plastic products.
3.4 Metal recycling
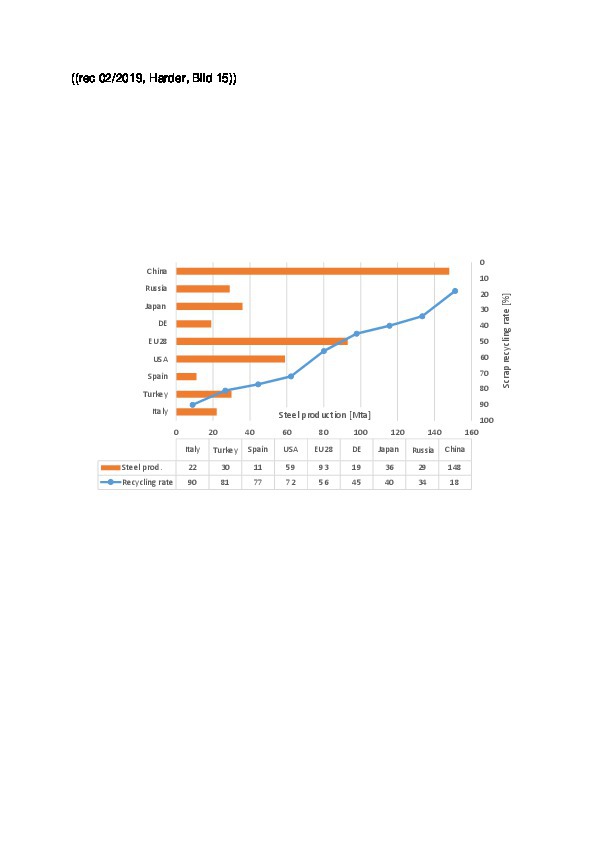
Steel and aluminum can be recycled again and again. In the global steel production output of just under 1700 Mta in 2017, about 670 Mta or 39 % of steel scrap was used. In the EU 28, an average of 56 % steel scrap was achieved (Fig. 15). The highest proportions were accounted for by Italy, Turkey, Spain and the USA. Russia and China had the lowest usage of steel scrap. In Germany, the use of steel scrap has been almost constant since 2011 at 43 to 45 Mta, while 8.2 Mta of steel scrap are exported and 4.5 Mta are imported. The worldwide trade in steel scrap was 99.1 Mta in 2017. For ferrous metals, the EU aims to achieve recycling rates of 70 % by 2015 and 80 % by 2030. EUROFER, the European steel industry association, complains that there are no binding definitions for tracking the used proportion of recycled metal.
The global production of aluminum stood at 64.3 Mta in 2018, which represents an increase of 52 % since 2010. In Europe (including Russia) the production quantity fell in the same period from 8.053 Mta to 7.781 Mta. According to data from the industry association European Aluminum, the aluminum industry of the EU28 + EFTA + Turkey achieved sales of € 39.5 billion (2017). 5.1 Mta of primary aluminum were produced, while 4.9 Mta were recycled (Fig. 16). The recycling rate was 53 %. In the case of aluminum beverage cans, the recycling rate is as high as 73 %. Recycling reduces the energy consumption by 95 % compared to primary production. The EU aims to achieve recycling rates of 50 % by 2025 and 60 % by 2030 – figures that have already been reached in some countries.
3.5 Building rubble recycling
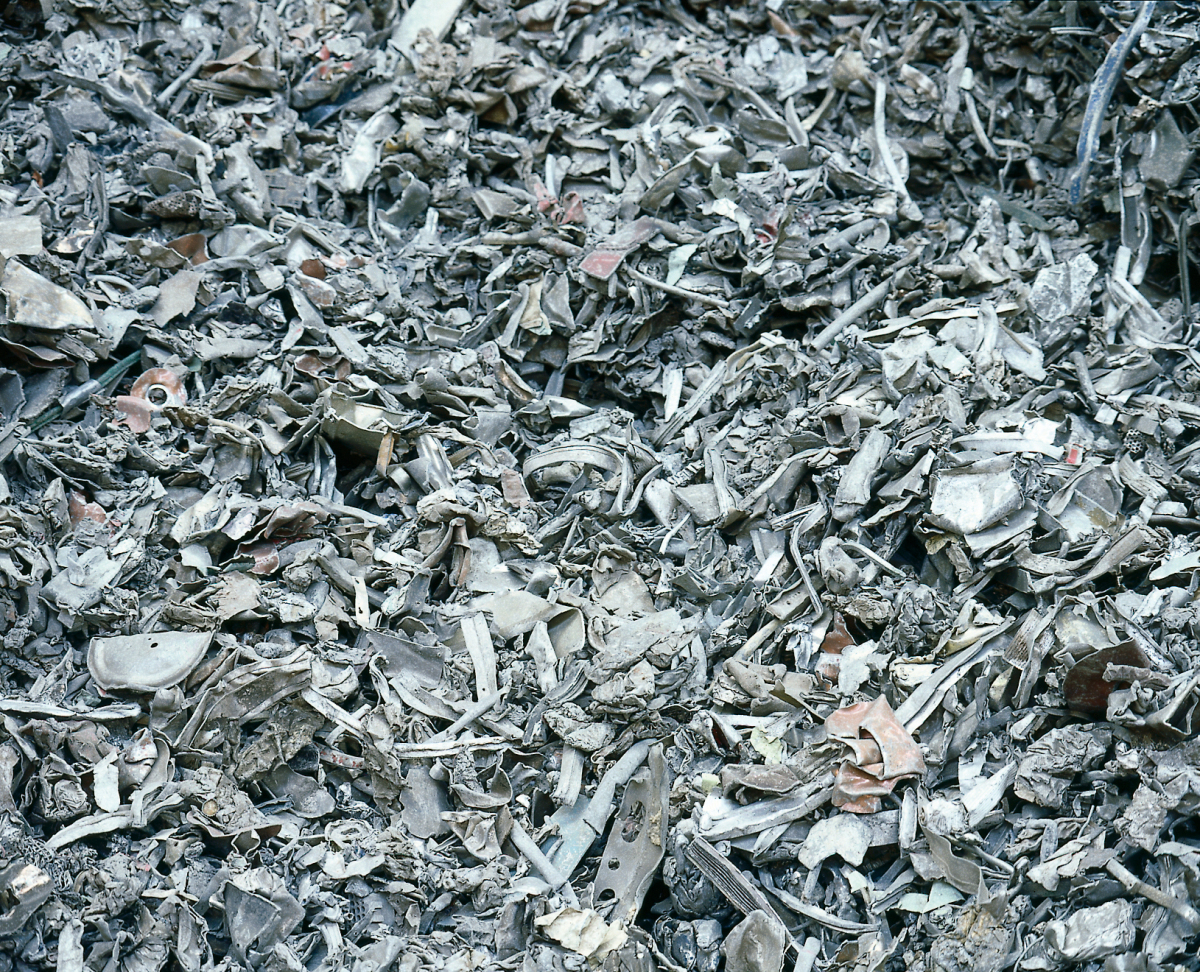
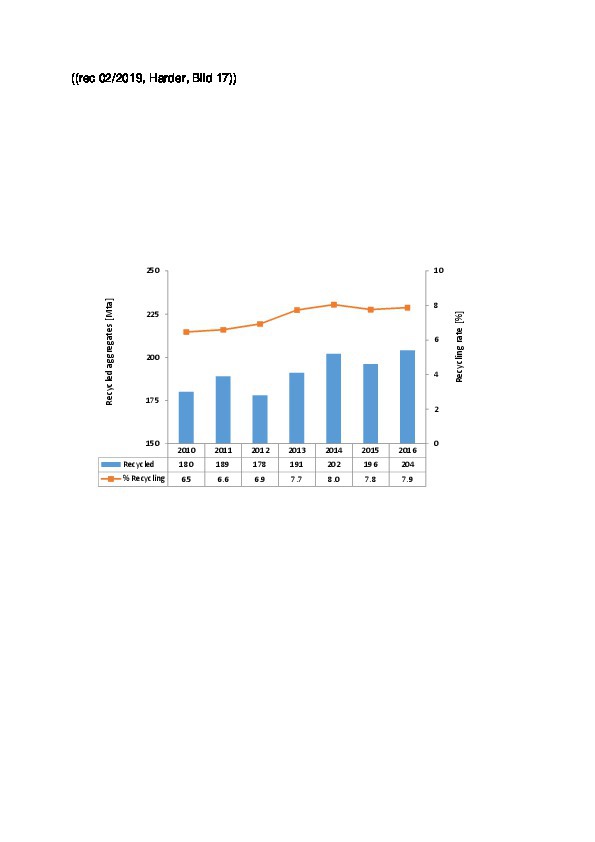
In the processing of building rubble, the produced recycled materials are concrete granulates and mixed demolition granulates which can be used in the concrete production process, replacing natural aggregates. Japan and Singapore are leaders in the recycling of building rubble and demolition waste, with recovery rates close to 100 % [6]. For the EU 28, Fig. 17 shows the recycling quantities for concrete aggregates that originate from construction waste processing. In 2016, a total of 204 Mta was recycled, which makes up 7.9 % of the production volume of 2590 Mta. This has further consolidated a slight upward trend. Germany is in first place with a recycled quantity of 68.0 Mta. The subsequent rankings are taken by Great Britain (54.0 Mta), France (21.8 Mta), the Netherlands (18.6 Mta) and Belgium (15.0 Mta).
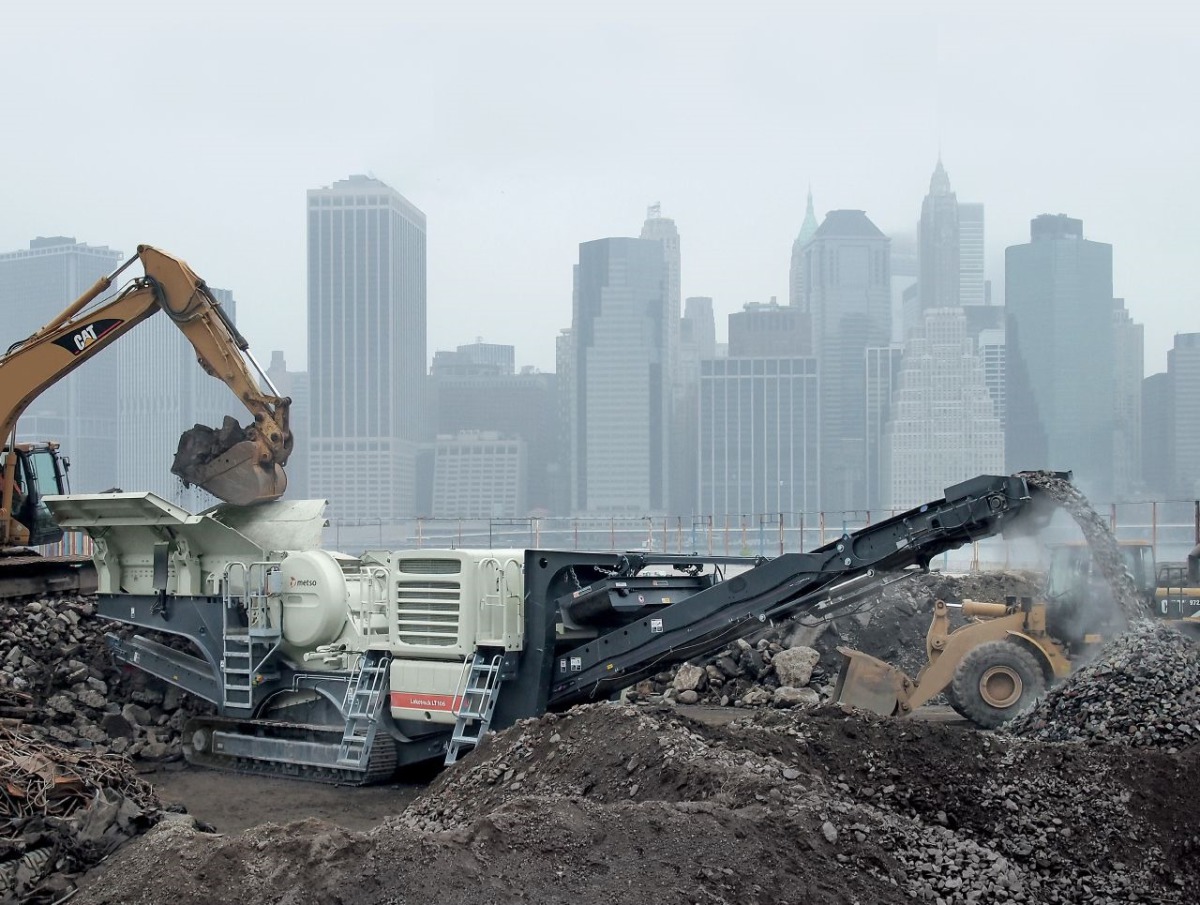
The high recovery rates in Germany and Great Britain are due to the large number of building rubble treatment plants in these countries. According to the figures of the Federal Statistical Office in Germany (Destatis), the number of building rubble treatment plants has grown tremendously in recent years. After a total of 2172 plants in 2012, their number increased to 2579 by 2014. Most of this increase is due to the use of mobile plants (Fig. 18), whose number has risen from 1393 to 1770, representing a growth rate of 12.7 %. The number of stationary plants rose from 779 to 809, which is a rate of just 1.9 %. On the other hand, the capacity of stationary building rubble processing plants increased by 65 %, from 73.2 Mta to 83.0 Mta.
3.6 Blast furnace and power plant by-products
In 2017, around 1180 Mta of pig iron were produced worldwide, compared to 1034 Mta in 2010, which means that about 350 Mta of blast furnace slag occur as a by-product. The blast furnace slag is cooled in the air or granulated with water. Granulated blast furnace slag (GBFS) is finely ground and has similar properties to Portland cement. The glass content of milled GBFS varies between 60 % and 100 % by volume, depending on the applied granulation process. The practices vary greatly from country to country. The highest granulation rates are found in Germany (87 %) and Japan (84 %). By contrast, the US has one of the lowest levels at 35 % (data for 2017). The granulation rate is an indicator of how the slag is used. While milled GBFS is used almost 100 % as a clinker substitute in cement, air-cooled blast furnace slag is used as a concrete admixture or finds some other use.
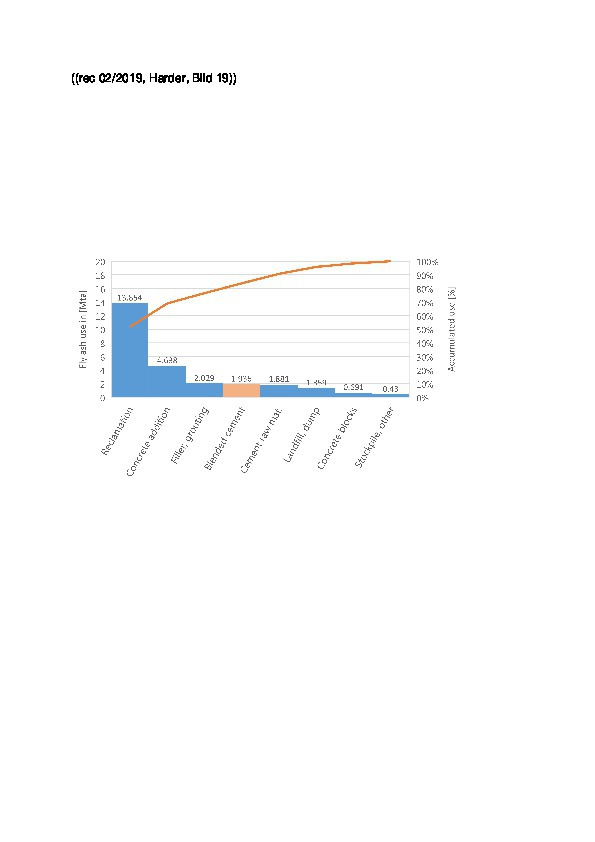
Fly ash is a by-product of coal power plants. Depending on the type of coal that is burnt, two types of ash are produced. Siliceous ash is derived from the burning of hard coal, while calcareous fly ash is produced by burning lignite. Both types of fly ash have pozzolanic properties and are used in Portland cements or concrete. According to the IEA (International Energy Agency), more than 675 Mta of fly ash are available worldwide. Fig. 19 shows the production and use of fly ash in Europe in 2016. Most of the produced fly ash is used for recultivation and backfilling. In fact, only 42 % of the produced fly ash is recycled. 1.936 Mta or 7.2 % of this are used in the production of cement. 4.638 Mta or 17.3 % are destined for direct use in concrete.
4 Prospects
Regulations relating to the circular economy differ significantly in individual regions of the world and in individual countries. The EU is considered the region with the strictest regulations. The examples there show, however, that the utilization practice also varies considerably from country to country within the EU. Countries with strict landfill regulations, such as Belgium, Germany, Denmark, Finland, the Netherlands and Austria, achieve by far the highest recovery rates for municipal and other waste materials. Other EU countries with fewer binding provisions lag significantly behind with their recovery rates. By 2035, the EU wants to restrict the landfilling of municipal waste to a maximum of 10 %. This is a step in the right direction, but environmental organizations consider that the specified date is set too late.