Vision and reality of the circular economy
 © Continental
![1 Development of the consumption of resources [2]](https://www.recovery-worldwide.com/imgs/1/8/5/1/3/4/3/01_Bild1L_MaterialExtraction-64536c97352a86ca.jpeg)
![Einsatz von Primärressourcen [2]](https://www.recovery-worldwide.com/imgs/1/8/5/1/3/4/3/137333211_c7ffac64f4-58189488e4085bd1.jpeg)
![3 Demand for primary resources [2]](https://www.recovery-worldwide.com/imgs/1/8/5/1/3/4/3/137333207_5d1a2f6a38-20564c19866c5496.jpeg)
![4 Fate of primary resources [2]](https://www.recovery-worldwide.com/imgs/1/8/5/1/3/4/3/137333203_0709c968f4-f9a3af045a5f5102.jpeg)
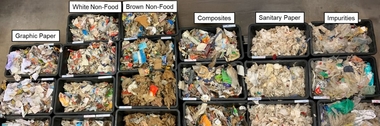
![5 Waste streams for the resources [2]](https://www.recovery-worldwide.com/imgs/1/8/5/1/3/4/3/137333194_0665b796b7-7efe53c92f705d40.jpeg)
 © OneStone Consulting
![7 Circular economy [6]](https://www.recovery-worldwide.com/imgs/1/8/5/1/3/4/3/07_Bild7L_Butterfly-17adc312dbca596a.jpeg)
![8 Resource consumption in 2060 [3]](https://www.recovery-worldwide.com/imgs/1/8/5/1/3/4/3/08_Bild8_Resources2060_1-fe45fae6a5e3fc25.jpeg)
 © UEPG
 © UEPG
 © UEPG
 © World Steel
 © International Aluminium
 © The Aluminium Association
 © OECD
![16 System change for plastics [10]](https://www.recovery-worldwide.com/imgs/1/8/5/1/3/4/3/16_Bild16L_2040__1_-d0a5cf0cd3fb4823.jpeg)
 © CEPI
 © CEPI
 © ETRMA
 © FEVE
Circular economy, resource efficiency and recycling: What is exactly the difference? In this report, we beginn by going into detail with regard to how our consumption of resources is developing and what percentage of these resources is reused or recycled. Why has the recycling rate actually fallen despite intensive efforts in recent years? What has to happen to go from a higher recycling rate to a circular economy or higher resource efficiency? In this context, several industries are examined more closely.
1 Introduction
Our industrialized global economy is dependent to a large extent on resources. This concerns renewable resources from agriculture and forestry as well as non-renewable raw materials like crude oil, natural gas, coal, ores and mineral resources, but also clean water, fertile soil, clean air and not least biodiversity or diversity of species. But all these resources are under threat, and the consumption of resources is also responsible for a large part of climate global warming. Fig. 1 shows how the consumption of resources has developed since 1972, the year when the book “Limits to Growth” was published [1]. According to this, resource consumption has increased 3.5 fold since then, a rapid increase being registered especially since the new millennium. By 2050, a resource consumption ranging between 170 and184 Giga tonnes per annum (Gta) is expected unless countermeasures are taken [2].
Fig. 2 shows what resources or primary materials were used in 2020. From the total quantity of 100.6 Gta, mineral resources (sand, aggregates, limestone, gypsum, marl, clay, etc.) alone account for 50.8 Gta (50.5 %) and biomass (agriculture and forestry products) accounts for 24.6 Gta. Fossil fuels make up 15.1 Gta (15.0 %) and ores (iron ore, other metal ores, non-metals, without coal) account for 10.1 Gta [1]. Fig. 3 provides important information on what people need these resources for. The construction industry accounts for the largest percentage with 38.6 %, followed by the food and nutrition industry with 21.2 % and services with 9.9 %. Healthcare provision (9.2 %), mobility (8.6 %), consumables (6.9 %) and communications technology (5.6 %).
Of the resources and primary materials consumed in 2020, 32.6 Gta were waste materials (Fig. 4), 14.6 Gta were emitted into the atmosphere, 22.4 Gta were distributed on the land and in the water and 31.0 Gta went into new building and structures. Of the waste streams, 8.4 Gta were recycled and 0.2 Gta products recovered (Fig. 5). The largest waste quantities with 11.2 Gta landed on landfills or with 7.4 Gta in mining waste (tailings). 1 Gta of the waste was incinerated, in addition, 4.4 Gta were not registered further and some of these were disposed of in the sea. Correspondingly, in 2020, only 8.6 % of the resources consumed were recycled or recovered. Compared to a quota of 9.1 % in 2018, this means there was a considerable decline worldwide [1]. Humankind is therefore still far off achieving a circular economy.
Worldwide, the consumption of resources is increasing faster than recycling rates and for the first time, the 100 Gta mark has been exceeded for the consumption of resources. The materials consumption of the global population will rise from 33 kg per capita in 2011 to more than 45 kg per capita in 2060 [3]. And that for a global population that will increase 1.5 fold in the same period. Greenhouse gas emissions will increase by 21 % by 2060 solely as a result of the resources consumed. The Netherlands is playing a leading role in recycling [4]. In 2020, 116 million tonnes per annum (Mta) resources were extracted in the country. From which with imports and exports, a recycling rate of 24.5 % is derived. High recycling rates are achieved for minerals and biomass. Norway, on the other hand, with extracted resources totalling 334 Mta, only reaches a recycling rate of 2.4 % and therefore lies at the tail end in Western Europe [5].
2 Circular economy, resource efficiency and recycling
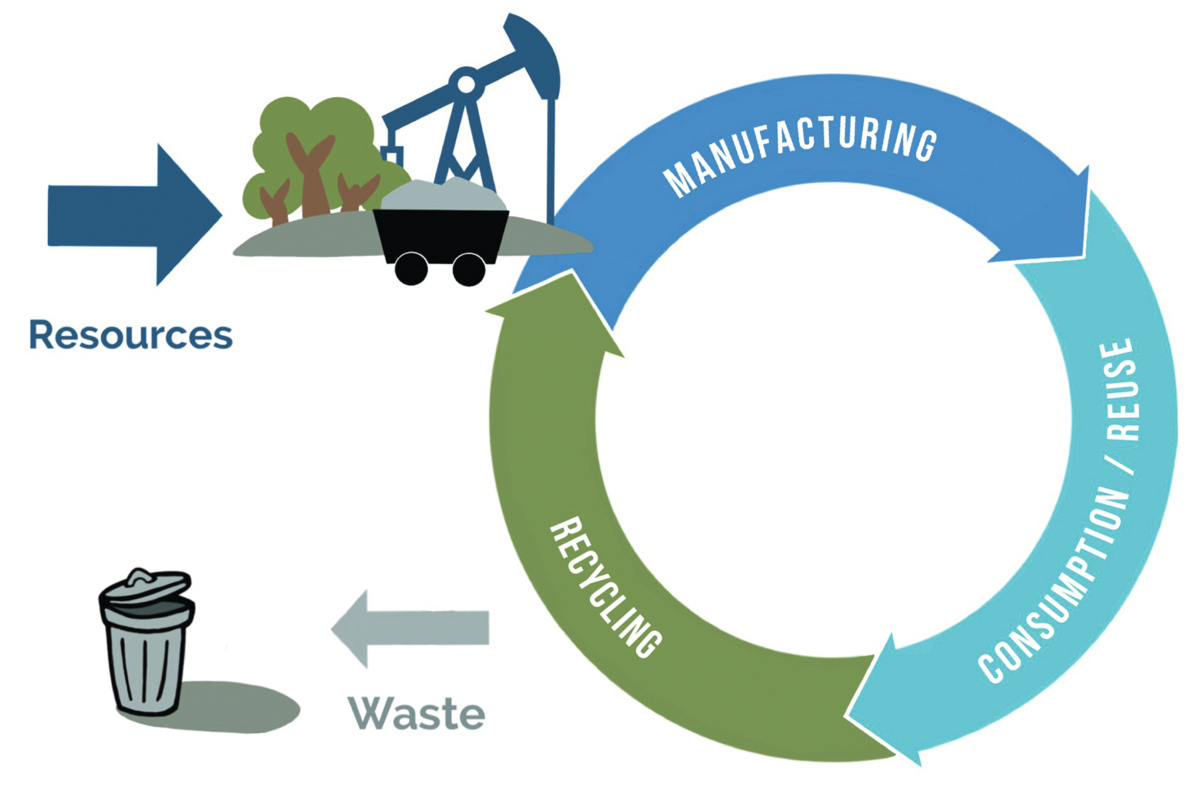
All too often, the circular economy is put on a par with recycling. Recycling comes primarily from waste management where it is a matter of processing end-of-use waste and returning it into the material cycle (Fig. 6). A circular economy, on the other hand, starts with avoiding waste by lowering consumption and avoiding any environmental impact. This is clearly illustrated by the so-called butterfly diagram (Fig. 7) [6]. Shown on the left side of the diagram is the biological cycle for materials that are biodegradable or renewable, like, for example, foodstuffs, cotton or wood. The focus is on the regeneration of the biosphere. Shown on the right side is the technical material cycle of the other materials, with multiple use, lengthening of the lifetime, reuse and finally recycling being paramount.
A considerate and at the same time efficient use of natural resources (resource efficiency) is therefore a key competence for this and future generations. It is a matter of decoupling economic growth and prosperity as far as possible from the use of natural resources, lowering the input of resources and consequently reducing the impact on the environment. Fig. 8 clearly shows which resources will probably register the highest consumption and at the same time high increases by 2060 [3]. Construction materials or resources for concrete and construction materials are at the forefront. Of the fossil fuels, the focus is on coal and natural gas. Oil production, on the other hand, will stagnate. Important are, however, the renewable raw materials, especially for nutrition, clothing and housing construction. Metals are required both for the construction sector as well as for machinery, electrical engineering and communications.
3 Recycling rates in various industries
Recycling rates are currently a good measure of how many resources are needed and reused and where the circular economy currently stands. For this purpose, several industries are examined more closely in the following.
3.1 Mineral resources
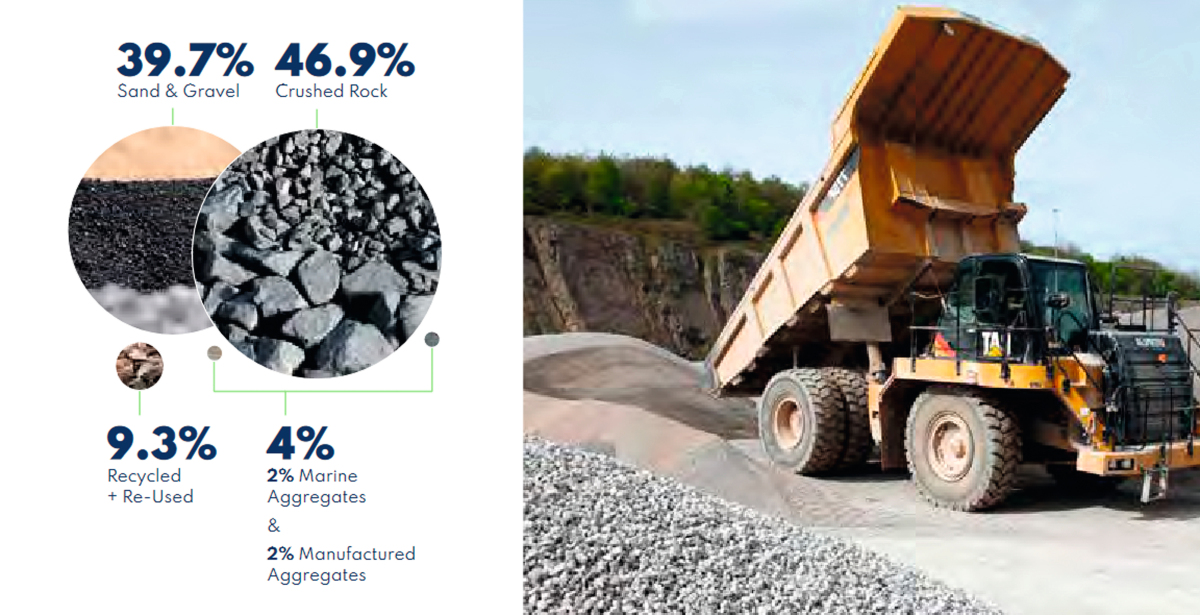
According to an OECD study [3], in 2017 the share of sand, gravel and aggregates in the global consumption of resources made up 32.6 % alone. Fig. 9 shows how the quantities were made up in the EU (incl. UK and EFTA) in 2020. Sand and gravel accounts for 39.7 %, crushed rock for 46.9 %, recycled products 9.3 % and others (marine aggregates and slags) 4 %. The European Aggregates Association UEPG emphasizes that if the entire construction waste were processed and recycled, only around 12 to 20 % of the current demand for aggregates could be covered. This is down to the fact that the largest quantities of raw materials go into the existing stock (buildings, structures and infrastructure) and only a small part from building demolition or road construction is available.
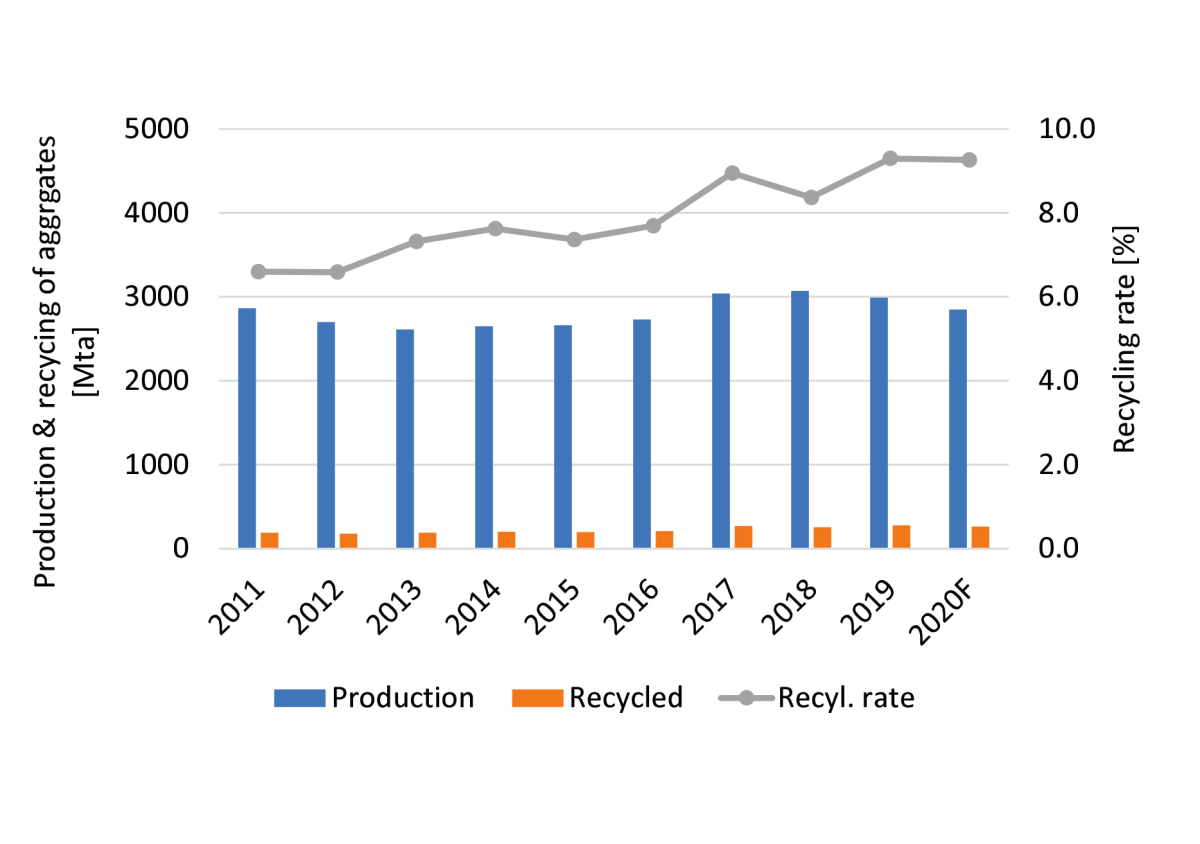
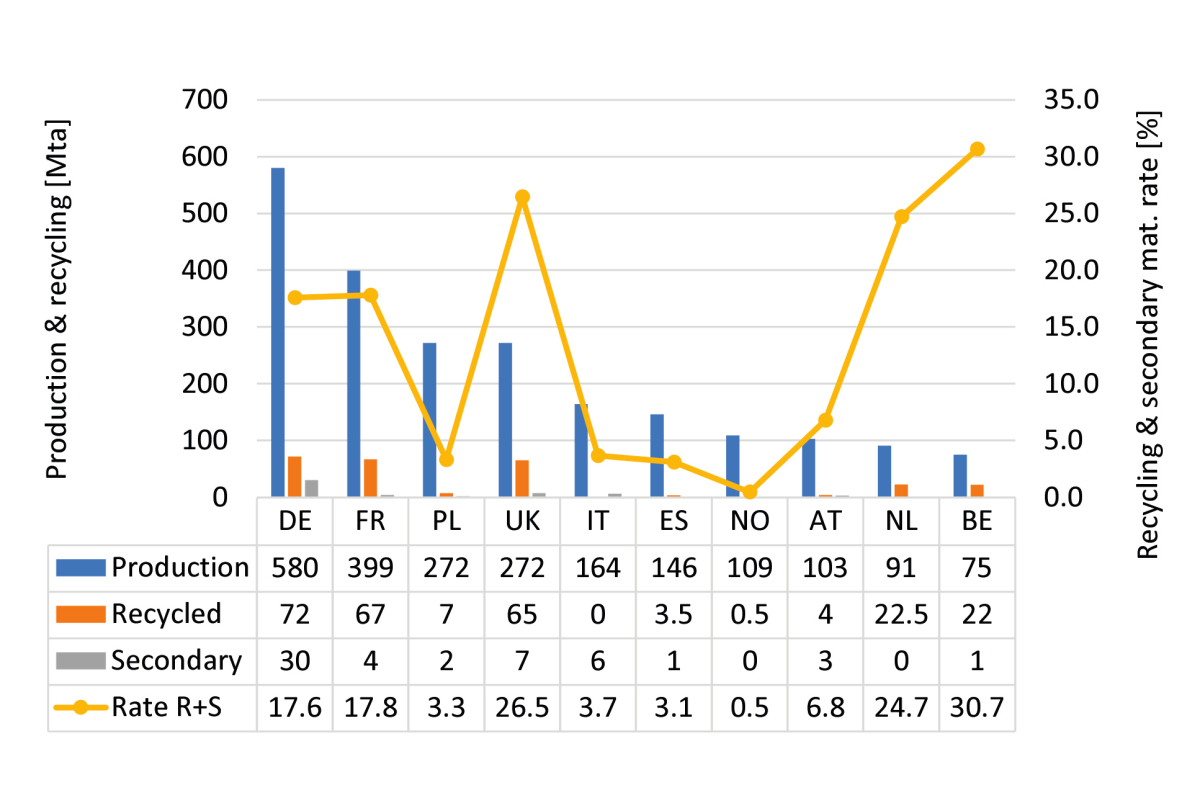
Fig. 10 shows how the demand for aggregates has changed in recent years in the EU (incl. UK and EFTA) and what recycling rates have been achieved. The quantities of sand, gravel and aggregates have remained relatively constant at 2800 Mta over the last ten years. The lowest value was reported in 2013 with 2610 Mta, whereas the highest value was registered in 2018 with 3070 Mta. In 2019, a peak quantity of 298 Mta was recycled, that corresponds to a recycling rate of 9.3 %. In addition, 63 Mta secondary materials (primarily slags) were used. The production data for the key countries in Europe are shown in Fig. 11. Germany, France and Great Britain report the largest quantities of recycled aggregates and secondary materials [7]. Belgium, Great Britain and the Netherlands report the highest recycling and secondary material rates, Spain and Poland lie towards the rear, Norway lies far back with a rate of 0.5 %.
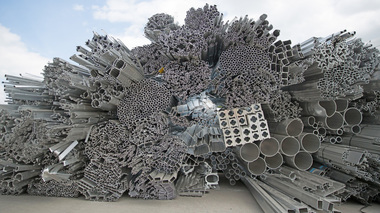
3.2 Metals
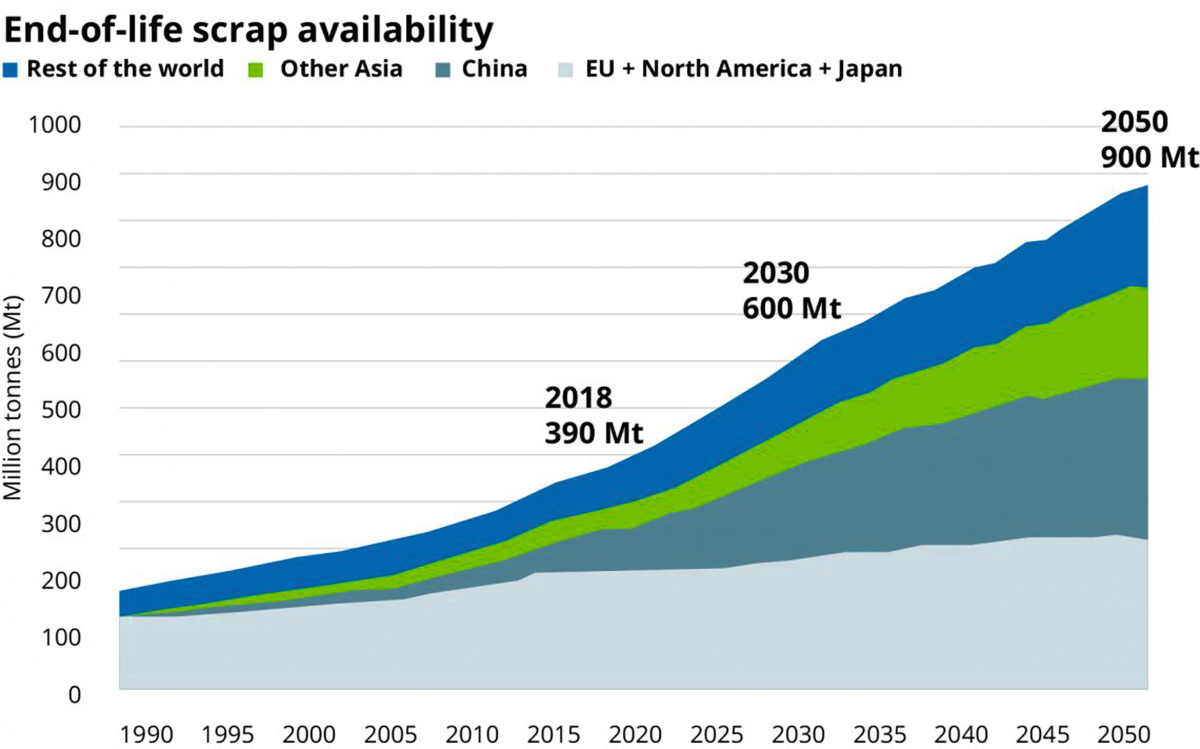
Metals are some of the most commonly recycled products [8]. This is because metals can be smelted almost any number of times without losing their characteristics. In 2019, 1951 Mta crude steel were produced. For this, around 490 Mta (25.1 %) scrap steel was used (Fig. 12). The potential quantities of scrap steel are, however, limited, although an increase from 500 Mta today to 900 Mta by 2050 is forecast. At present, around 85 % of the scrap steel produced is collected from the demolition of buildings and structures, machinery, cars and similar and recycled. As a result of the growing consumption of steel in the development and threshold countries, there primarily increases in recycling are expected, while recycling has already been largely exhausted in western industrial countries.
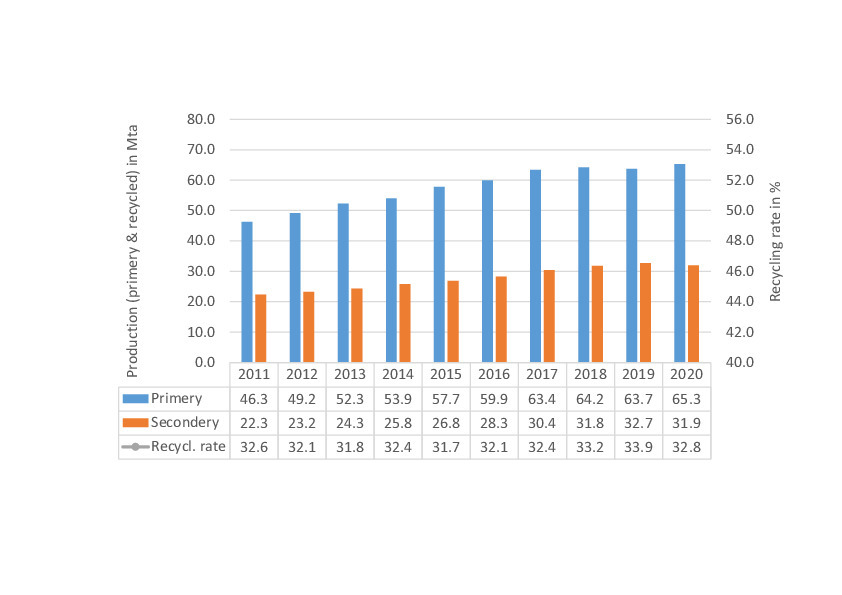
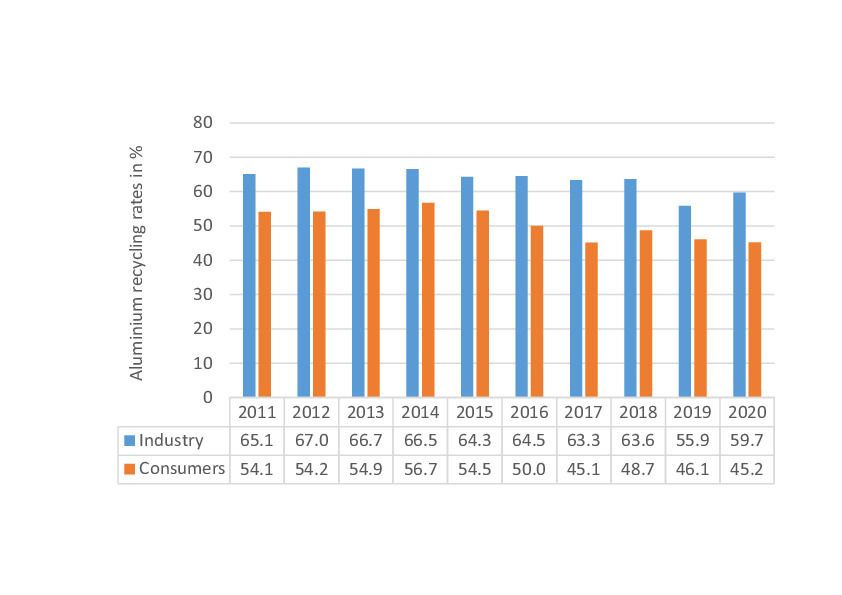
According to a market study by CRU International, global aluminium consumption is set to increase from 86.2 Mta in 2020 to 119.5 Mta in 2030. That corresponds to almost 40-% growth. Market drivers are the automotive industry, construction industry, packaging and electrical engineering. Fig. 13 shows production development over the last ten years, broken down by primary and secondary production (recycling). The average global recycling rate has been reasonably constant at 32 to 34 % in recent years. In the USA (Fig. 14), but also in other western countries, relatively high recycling rates are achieved, sometimes, however, with the import of recycled goods. Interesting is that recycling rates have fallen in the USA in recent years and in the consumer sector only 45 % is recycled compared with over 56 % in previous years.
3.3 Plastics
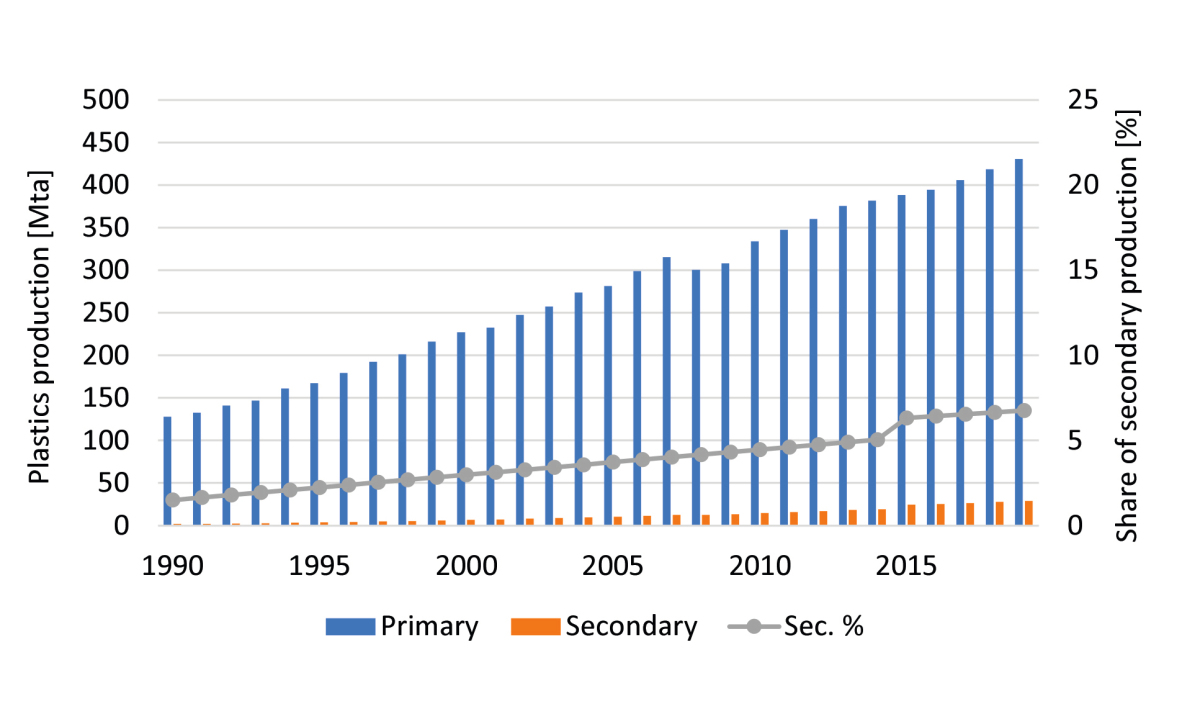
Vision and reality in the circular economy deviate furthest from each other with regard to the plastics industry. Global plastics production increased from 130 Mta in 1990 to 460 Mta in 2019. This is a 2.5-fold increase, this being primarily attributable to the rapidly growing consumption in less developed countries in Asia, Africa and Latin America. The share of secondary plastics, i.e. the plastic that has been material-recycled, increased from 1.5 % to 6.8 % (Fig. 15). This is the finding of a study recently published by the OECD (Organization for Economic Co-operation and Development) in 2022 [9]. However, this increase is outweighed by the realization that worldwide more plastic waste lands on landfills or uncontrollably pollutes the environment than the quantities that are recycled.
Fig. 16 shows that the future challenges are not only to recycle higher quantities of plastic waste, but that a paradigm shift also needs to take place. The goal is only to permit ocean pollution of 5 Mta (1 Mta microplastics, 4 Mta macroplastics) by 2040 instead of the 29 Mta that would result with the “business as usual” model [10]. To this end, various measures are necessary. Consumption has to be reduced by 130 Mta by moving away from the use of plastics or by increasing the multiuse of plastics, which saves around 30 % plastic waste. 71 Mta are to be substituted by other products. 84 Mta can be recycled if the capacities for mechanical recycling are increased to 86 Mta and those for material recycling to 13 Mta. 101 Mta have to be recycled to energy or go to landfill. Uncontrolled disposal has to be reduced by 44 Mta. That also means cutting waste exports to critical countries by at least 90 %.
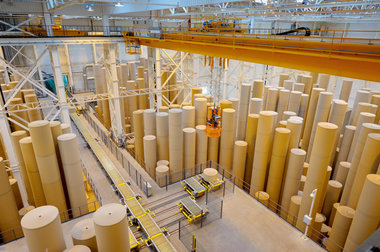
3.4 Paper & cardboard
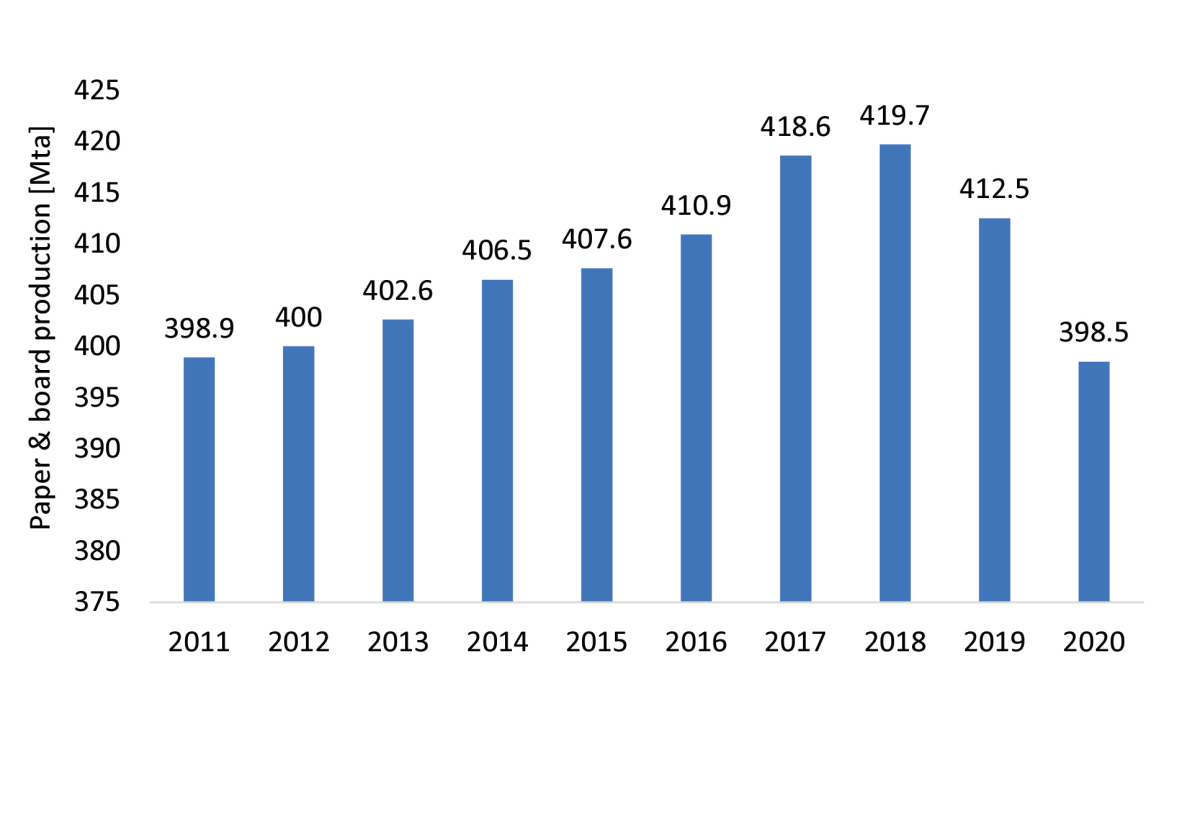
The global production of paper and cardboard has been on the decline for some time (Fig. 17). In recent years, this had to do both with the break-out of the Covid pandemic but also with the decline in the sale of paper for newsprint. On the other hand, the market for packaging is on the up. The output of paper and cardboard reaching around 420 Mta in 2018 was according to the BIR (Bureau of International Recycling) produced by almost identical parts from newly produced cellulose (209 Mta) and recycled paper and cardboard (211 Mta). That corresponds to a global recycling rate of 50.2 % in paper production. In 2019, this rate increased to 51.15 % with a fall in paper production. Around 86 % of the recycled quantities comes from packaging material, 5 % from newsprint paper and 9 % from other paper waste.
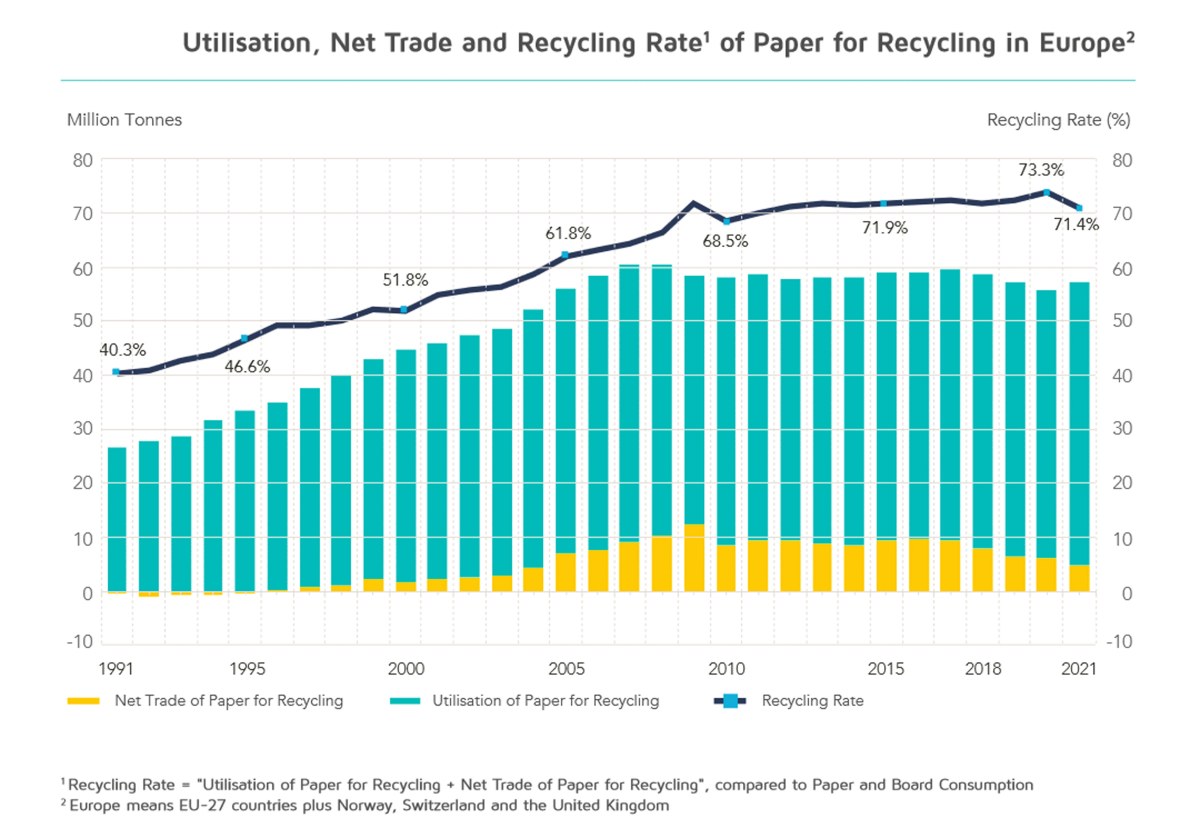
Europe is one of the regions with the highest recycling rates for paper and cardboard. According to Fig. 18, recycling rates increased from 40.3 % in 1991 to 73.3 % in 2020. In the last few years, however, recycling rates have been stagnating, like the recycling quantities and paper consumption. In Europe (EU + UK, NO and CH) around 55.4 Mta paper were collected in 2021. 6.9 Mta went into export, 2.2 Mta were imported and 50.7 Mta were used in the production of 90.6 Mta paper. That corresponds to a recycling rate of 56 %, which lies above the global average of 51.2 %. Five years ago, China announced that it would limit its imports of paper waste. Accordingly, imports of paper waste were almost completely stopped from 25.7 Mta in 2017 to 0.5 Mta in 2021. Part of the European paper waste has since been exported to India and Southeast Asia.
3.5 Others (rubber, glass)
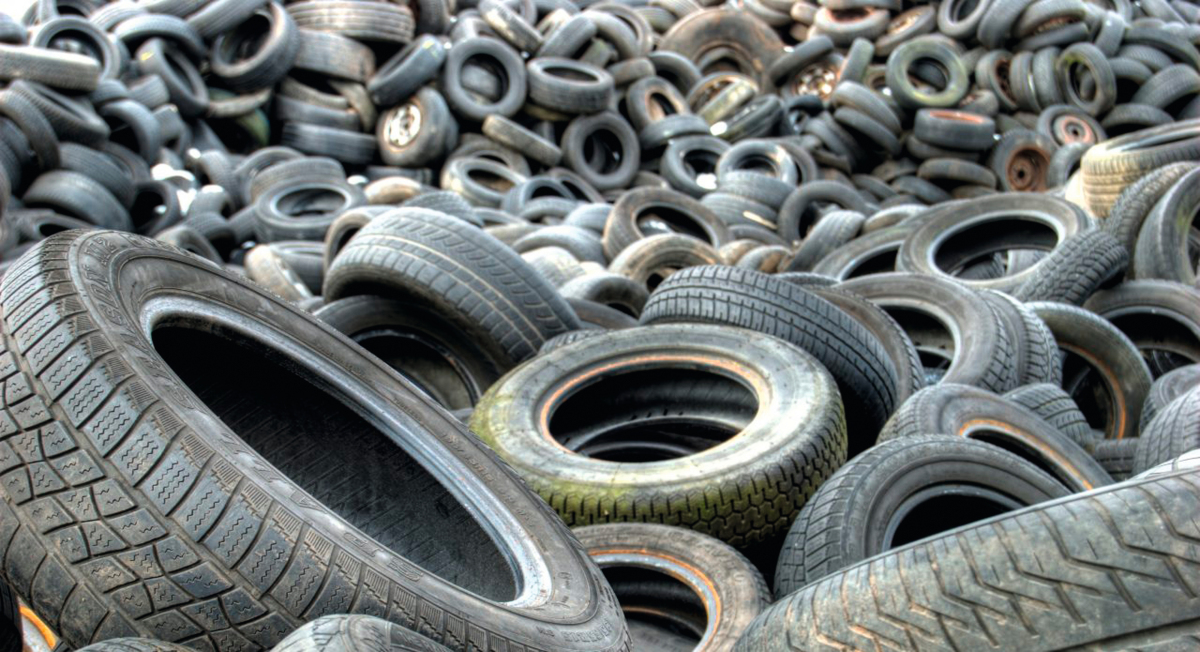
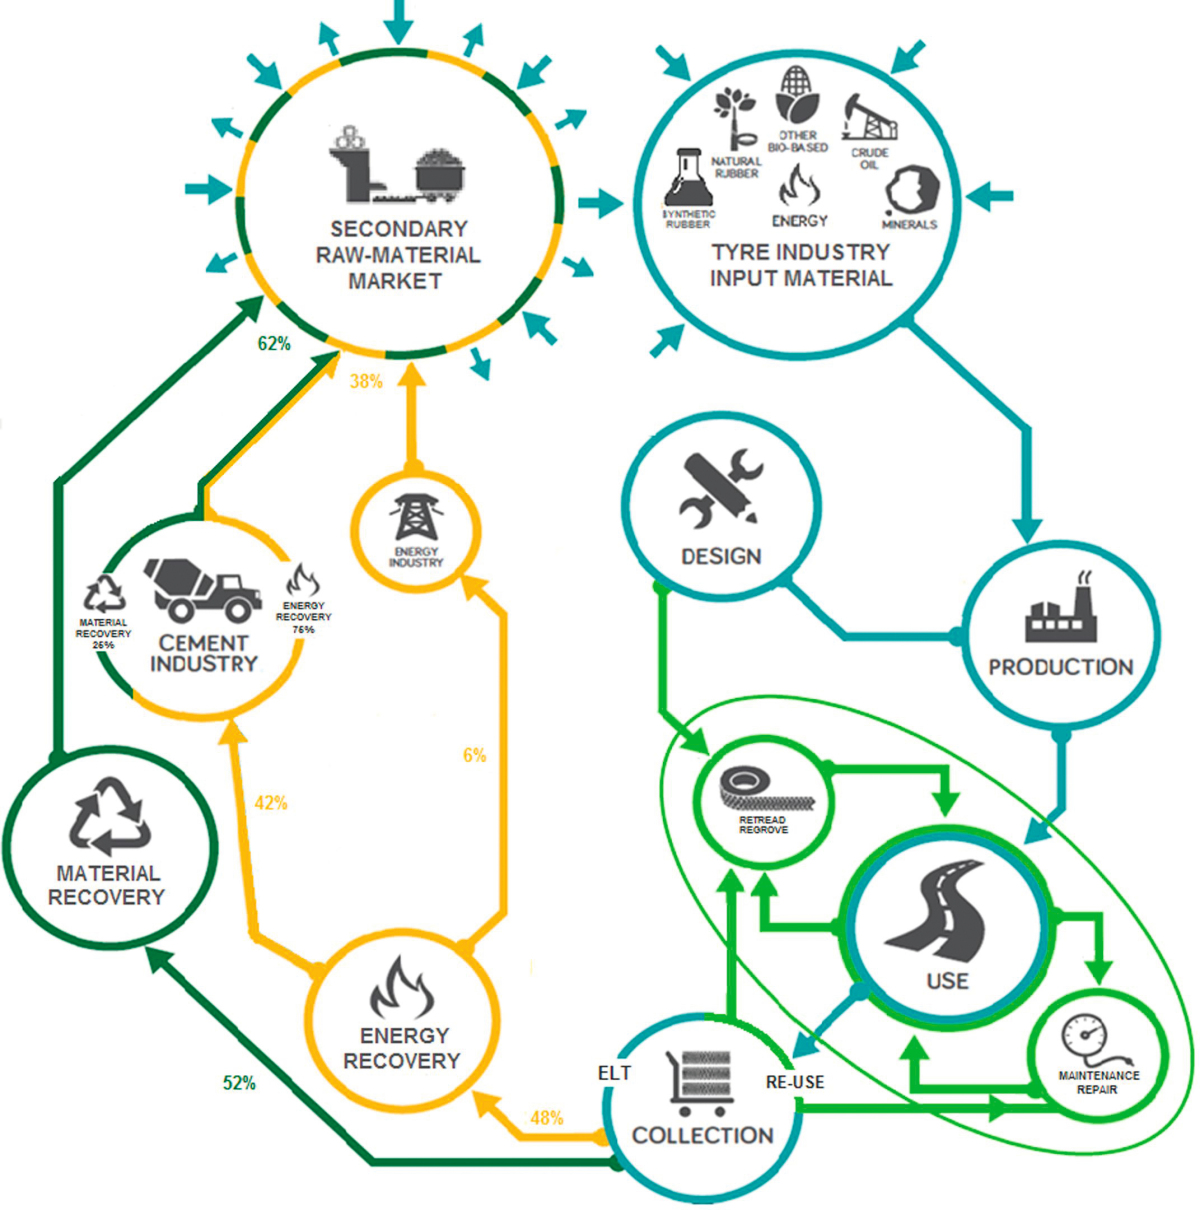
According to the latest figures from the IRSG (International Rubber Study Group), in 2021 13.8 Mta natural rubber and 15.7 Mta synthetic rubber were produced worldwide. That corresponds roughly to the level before the Covid pandemic. For the next few years, annual growth of 3.5 to 3.6 % has been forecast. The EU27 took a share of 14 % in the production of synthetic rubber in 2020. Fig. 19 shows a graphic from the European Tyre & Rubber Manufacturer’s Association (ETRMA) on the recycling of end-of-life tyres from 2017.
For 2019, the following breakdown of quantities for EU27 + NO, CH, TR results. According to this, with 3.26 Mta, around 95 % of scrap tyres were collected and recycled. 55 % went to material recycling and 45 % into waste-to-energy recycling. Of those tyres that were sent for material recovery, 69 % went into tyre regranulation and 24 % were used as raw materials for the cement industry, which is not material recovery in the actual sense.
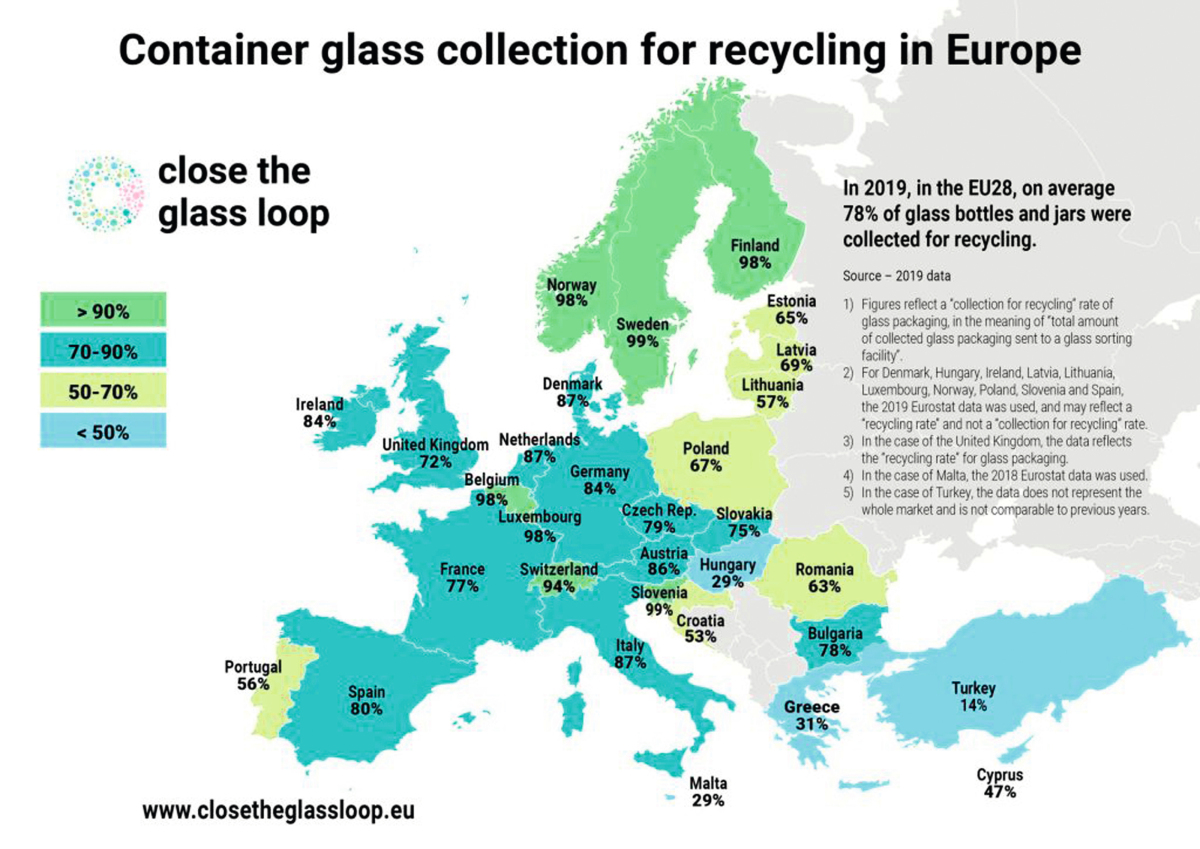
For container glass, worldwide average recycling rates of 35 % are achieved compared with 32 % in 2017 [11]. Recycling rates in Europe (EU 27, UK) rose from 74 % to 78 % (Fig. 20), with Sweden, Finland, Belgium and Luxemburg even reaching rates from 98 to 99 %. With production quantities of 21.8 Mta container glass, in Europe around 17 Mta container glass is recycled. This should not belie the fact that the figures are much lower in other regions of the world. Countries like Turkey or Singapore only reach a 14 % recycling rate. If, besides container glass, you include the relatively low recycling rates for flat glass (11 %) and household glass, the average worldwide glass recycling rate reaches just over 20 %. The potential is still huge.
4 Outlook
A growing global population and ever improving living standards will further drive the consumption of resources higher. In 2022, the global population had already consumed the resources available for the year by 28 July (so-called Earth Overshoot Day). In the USA, this day was already reached on 15 March, in Germany on 4 May and in China on 2 June. The time span for this day will become ever shorter in future and soon the fears of the Club of Rome from 1972 will become reality. The vision of a circular economy will become increasingly unrealistic if massive measures are not introduced now for the efficient use of resources. Policy-makers are called upon to set incentives, industry is called upon to invest in recycling and durable products and we as consumers have to finally move away from the throwaway mentality and make our contribution to resource efficiency.