Recycling in the EU in the pandemic era
 © Mondi Group
 © OneStone Research
 © Umweltbundesamt
 © Eurostat
 © Eurostat
 © Eurostat
 © Eurostat
 © Eurostat
 © bvse
 © Plastics Europe
 © bvse
 © Plastics Europe
 © Carboliq
 © Euratex
 © bvse
 © bvse
 © bvse
 © Volkswagen
 © Eurostat
 © Eurostat
The European Union (EU) is striving to become a global pioneer in the recycling economy. Only in times of crisis is it possible to clearly gauge the progress made. The following paper discusses where the EU currently stands in recycling, which new challenges the corona pandemic has brought and what the current situation is with regard to packaging waste, plastic and textile waste as well as spent batteries.
1 Introduction
Throwaway packaging discarded in roadside ditches, car tyres, fridges and old paint tins left in woods, yellow bin bags full of recyclables strewn over carparks and household waste stuffed into public waste bins. The illegal disposal of waste is not just a problem in Germany, but Europe-wide. During the corona pandemic, habits have inevitably changed. One upshot is a new wave of online shopping, leading to ever larger volumes of packaging. Cellar and wardrobe clear-outs resulting in long waiting times at waste and recycling centres, bureaucratic procedures for waste acceptance and the rejection of certain types of waste, but also overflowing waste collection containers have prompted widespread anger. On the other hand, recycling awareness has fallen as a consequence of ever new rules and regulations. This applies especially to throwaway items that consist of a mix of materials or are soiled or contaminated, like, for example, protective face masks.
Nevertheless, recycling is a major priority in Europe. In the European Union (EU), more than 2.5 bill. tonnes waste is generated each year. To promote the transition from a linear to a circular economy, the EU regulations for waste management have been updated. In March 2020, the European Commission presented a new action plan for the recycling economy. It contains proposals for more sustainable product design and is aimed at reducing the volumes of waste generated and at large-scale recycling of waste. Moreover, in February 2021, the European Parliament adopted a resolution pursuant to which more stringent recycling targets and binding reduction targets for the use and consumption of materials will be mandatory already by 2030.
The plan of action for the recycling economy is oriented to waste avoidance, with products being made easier to repair and their lifetime lengthened. This is aimed at promoting the economic growth and competitiveness of the EU. In addition, the global leadership role of the EU in sustainability and consumer rights is set to be strengthened with this policy approach. The new action plan is consistent with the EU-2050-climate neutrality goal and is one of the key elements of the European Green Deal as well as being part of the new EU industry strategy. The focus will be on resource-intensive sectors such as electronics, plastics, textiles and construction.
2 Key data on recycling in the EU
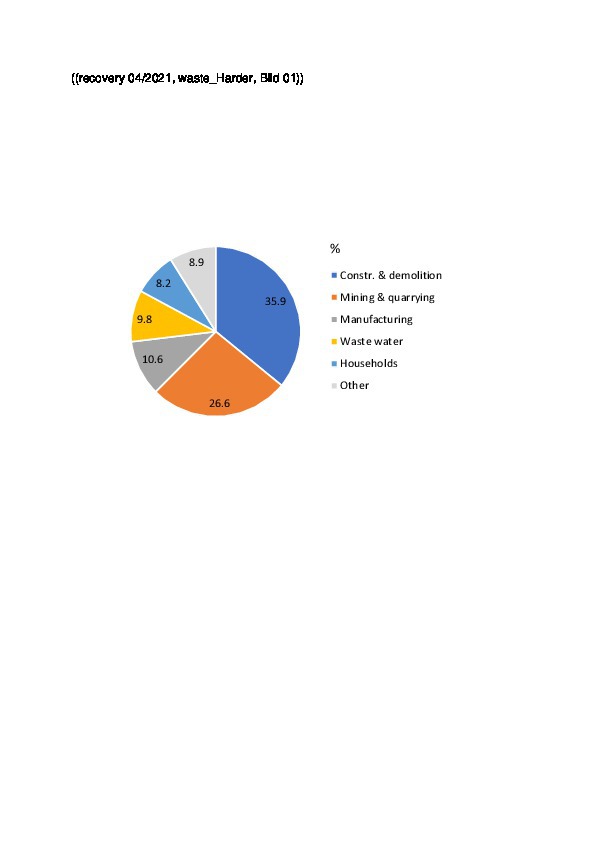
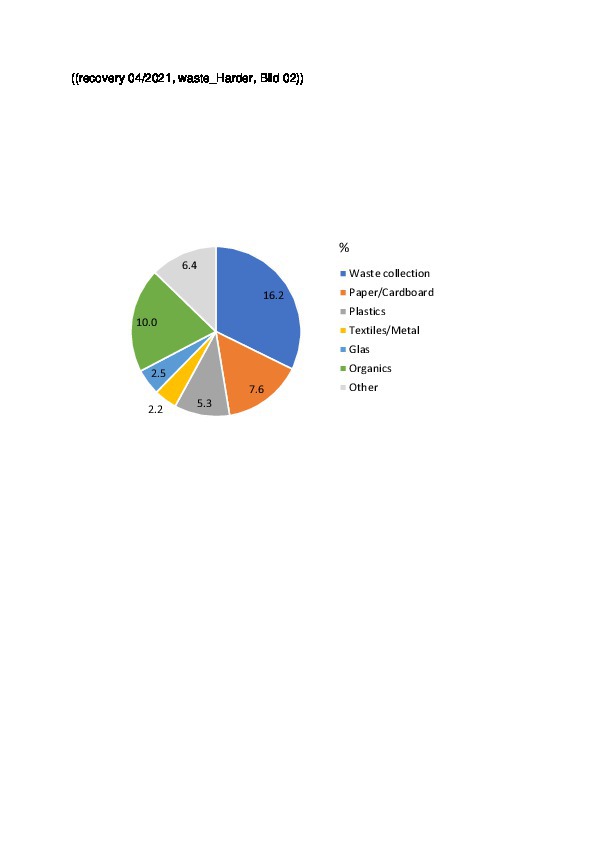
In the EU (EU27), in 2018, according to Eurostat figures (Statistical Office of the European Union), around 2340 mill. tonnes waste per annum (Mta) were generated. This corresponds to around 5.2 t per capita of the EU population. As Fig. 1 shows for 2018, household waste only accounts for 8.2 % of waste volume. The main shares are those for construction / demolition waste, waste from mining and quarrying, from manufacturing and waste-water treatment. Unfortunately, up-to-date data on the composition of household waste, which is significant particularly with regard to recycling, cannot be found in the EU statistics. Fig. 2 shows how household waste was made up in Germany in 2018. It can be seen that the separately collected quantities of paper & cardboard, plastics, glass, metals and textiles range at only around 35 % of the overall volume.
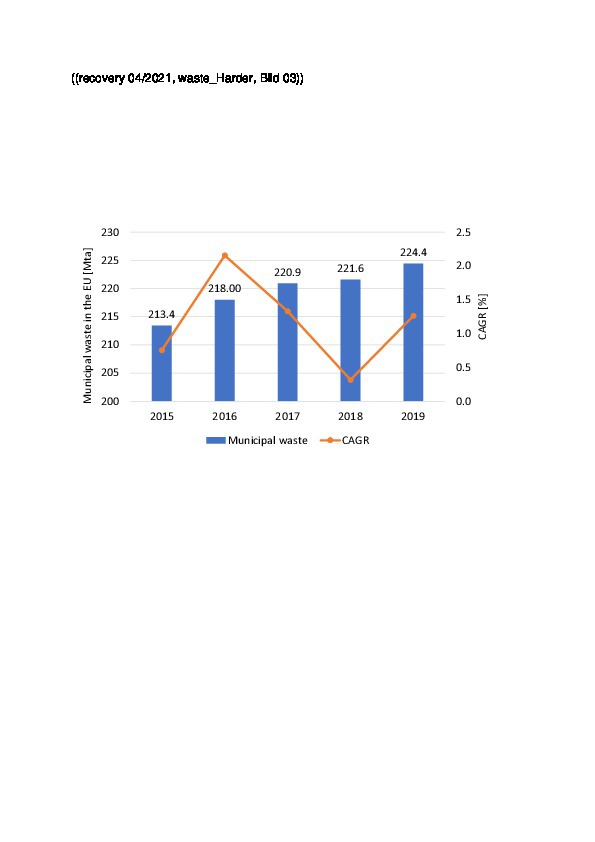
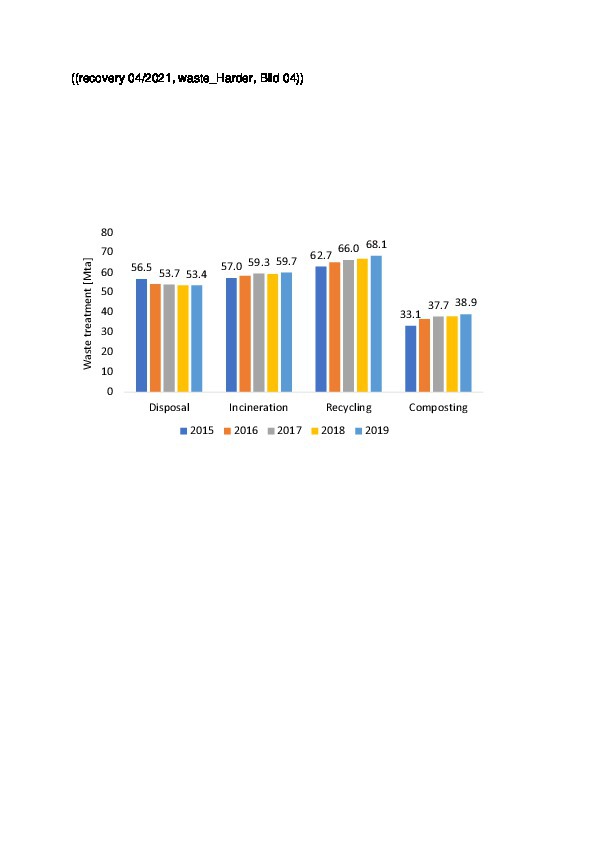
Eurostat provides the following Fig. 3 for the household waste generated in the EU27 states. The quantities have increased from 213.4 Mta in 2015 to 224.4 Mta in 2019. This corresponds to around 502 kg per capita, and is a slight decline on the peak of 518 kg per capita in 2008. Fig. 4 shows what quantities of household waste were treated and how they are distributed between the different waste disposal options. The recycling quantities experience the largest increases with 62.7 Mta in 2015 and 68.1 Mta in 2019. But the quantities sent to waste incineration and energy recovery are rising notably, too, as are the quantities that are composted. Only the waste for landfilling is on the decline, which is also a declared goal of the EU. By 2050, landfilled waste is to make up less than 10 %.
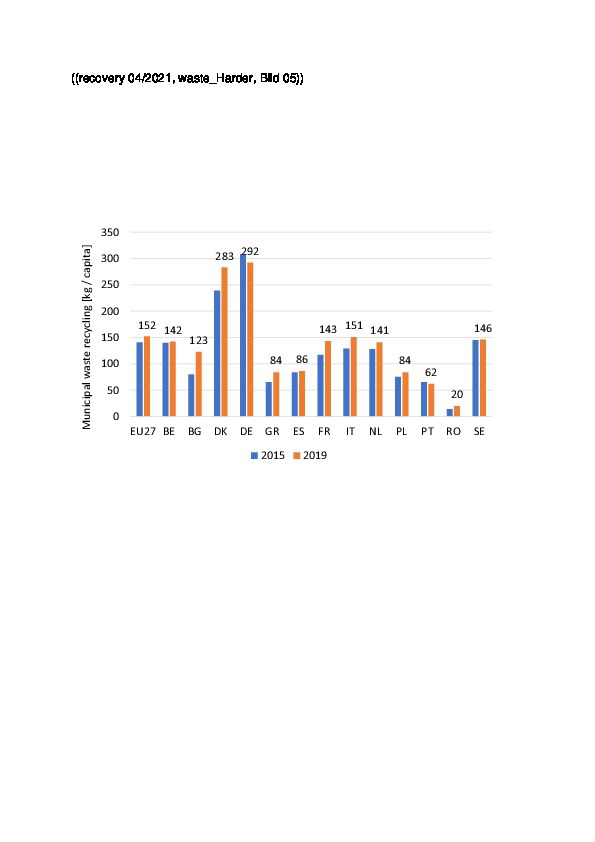
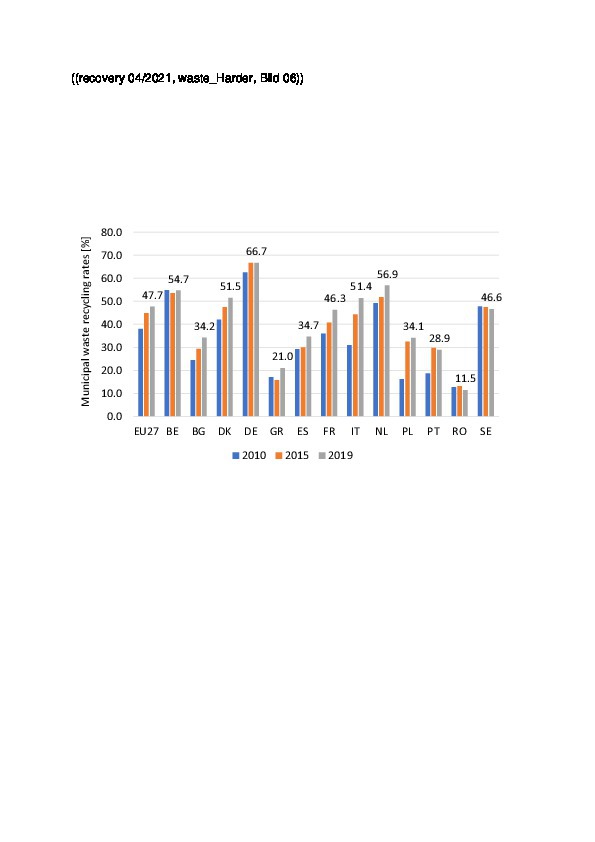
Fig. 5 shows the per-capita recycled quantities for household waste in selected countries in Europe. The average value in EU27 stood at 141 kg in 2015 and 152 kg in 2019. Germany and Denmark reach the highest recycling levels with 292 or 283 kg per capita, respectively. The lowest levels are recorded in Spain, Greece, Portugal and Poland. Lagging far behind in last place is Romania with just 20 kg per capita in 2019. The recycling rates for household waste provide information on the relative quantities (Fig. 6). In Germany, in 2019 around 66.7 % of household waste was recycled, in the Netherlands 56.9 %, and in Belgium 54.7 %. So these countries report well over the EU27 average of 47.7 %. Far below the average lie Bulgaria, Greece, Spain, Poland, with Romania in last place. To achieve the targets in the action plan, considerable efforts are needed. This becomes clear from the EU’s current monitoring report [1].
3 Paper and packaging waste
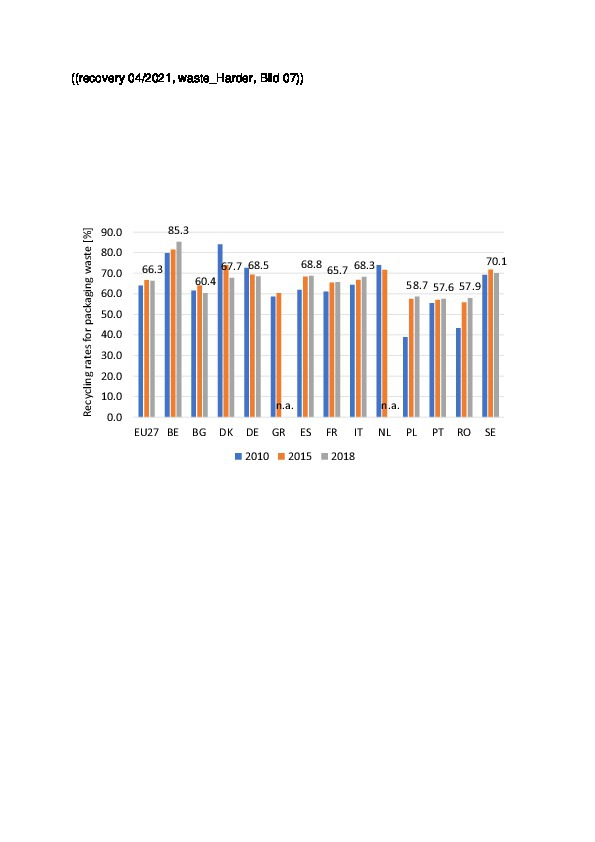
In packaging waste, the highest recycling rates are achieved in Europe. Unfortunately, no data on this are currently available from Eurostat, the last recorded statistics year being 2018. In the EU27, 174 kg packaging waste was generated per capita of the population in 2018, 140.8 kg was collected, 115.3 kg was recycled, corresponding to a recycling rate of 66.3 %. This value has remained almost unchanged since 2014. From 2016 and 2017, with 67.5 %, however, even higher rates were registered. The highest rates are achieved by Belgium 85.3 % and Finland (70.2 %) (Fig. 7). Germany has lost ground from 2009 (73.5 %) to 2018 (68.5 %). At the bottom end of the ranking are Hungary (46.1 %), Portugal (57.6 %) and Romania (57.9 %). Accordingly, apart from Hungary, all countries reached the recycling target of 55 %. The EU’s target value of 65 % for 2025 and 70 % in the year 2030 should be widely met.
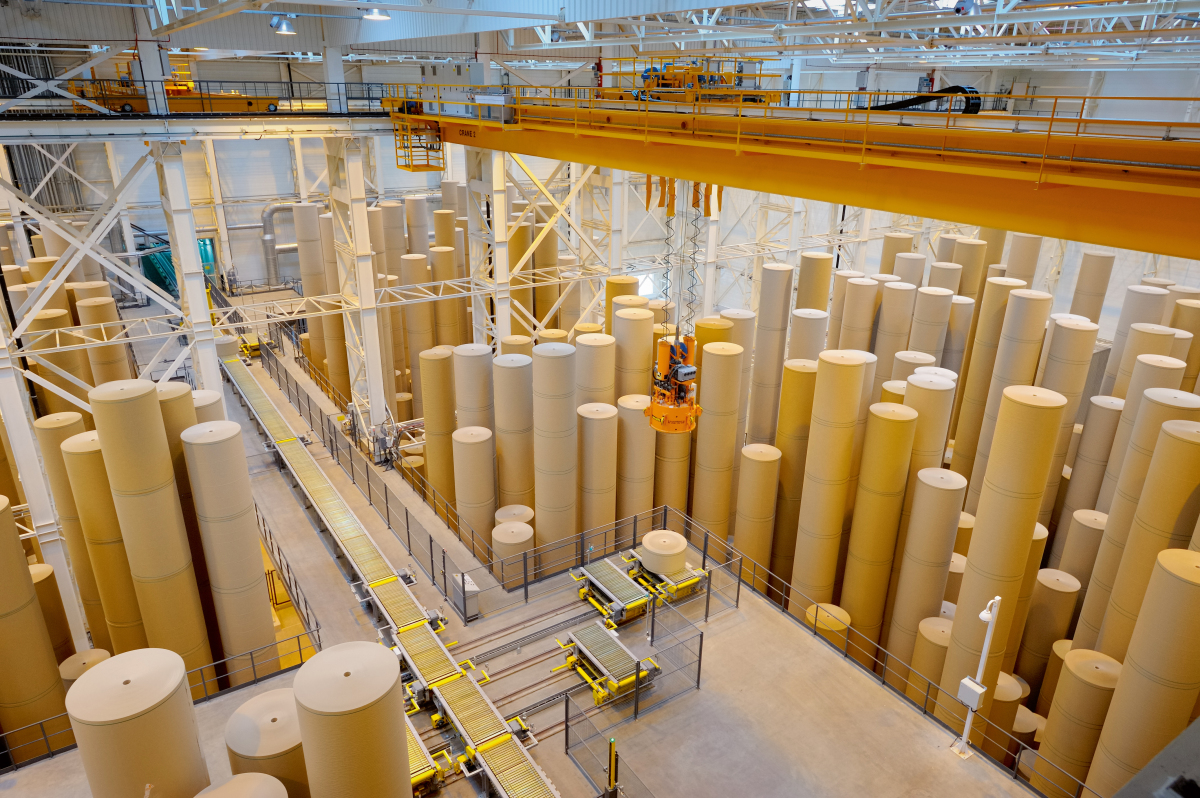
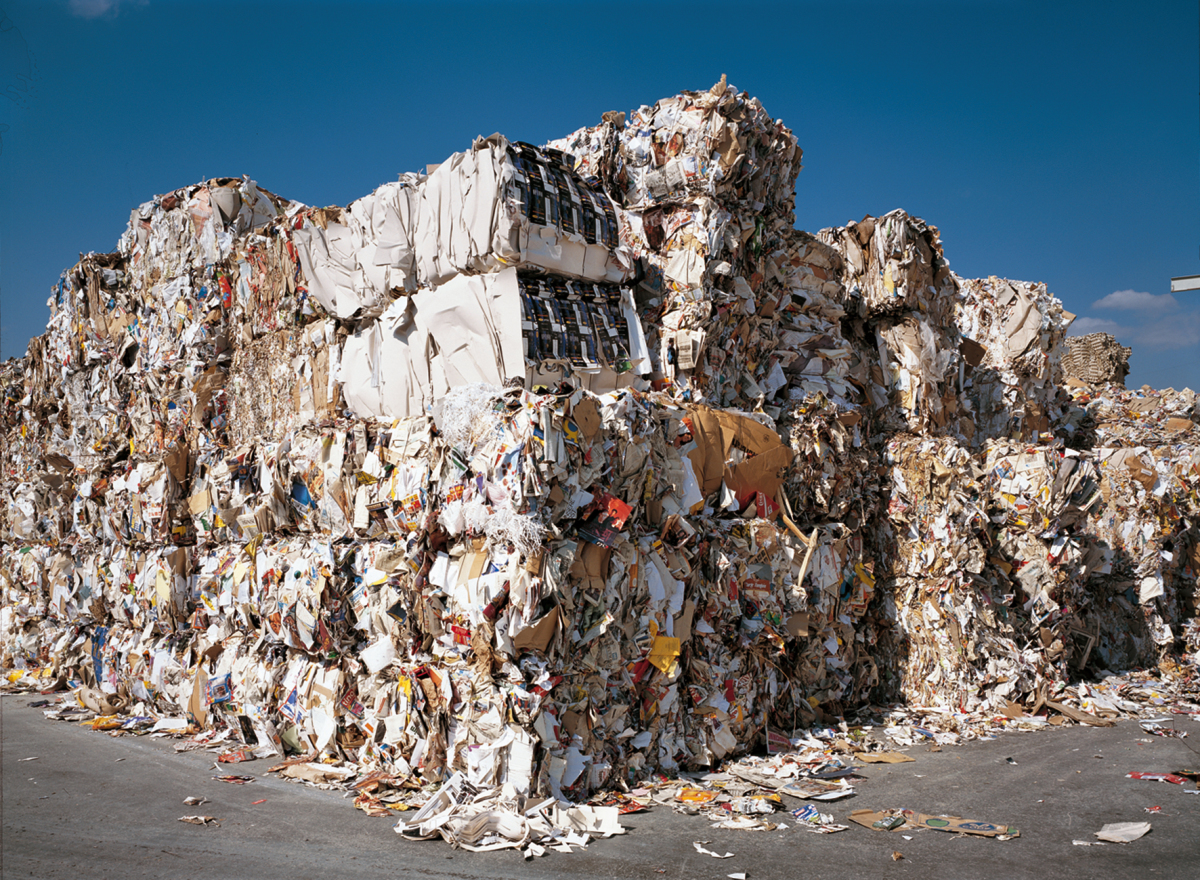
In the EU, paper and cardboard with 31.8 Mta in 2018 make up the highest share in packaging waste, ahead of plastics (14.8 Mta) and glass (14.5 Mta). The percentages for paper and cardboard have probably further increased recently because, as a result of the Corona pandemic, a sharp increase in online shopping (Amazon effect) has been registered. This also becomes clear from the figures from CEPI (Confederation of European Paper Industry). In the CEPI member states, the quantities of produced cardboard and packaging paper rose by 2.1 %, household and hygienic paper registered a 1.9-% increase, Overall, however, paper and cardboard production in the EU fell by 6.6 %, and by 5.0 % in the CEPI member states. Newspaper and writing paper suffered losses of 20.5 % and 18.4 %, respectively.
Paper recycling and the demand for waste paper (Fig. 8) had an up and down year in 2020. First, demand was affected by a ban on imports imposed in China, where, after 24.2 Mta in 2019, only just 6.7 Mta were imported in 2020. Second, the Corona pandemic has left its mark. Following a restrained demand at the beginning of 2020, the demand for waste paper rose sharply in the second quarter as the pandemic progressed. By the third quarter, the markets were largely saturated, and in the last quarter, the high demand continued. The use of waste paper in the production of the CEPI states decreased in the year 2020 by 2.1 % and reached a quantity of 47.8 Mta. 96 % of waste paper quantities come from the EU, exports of waste paper fell by 8.4 %.
In Germany, where 227.5 kg packaging waste per capita was generated in 2018, the consumption levels for waste paper in 2020 stood, according to the Association of the German Paper Industry (VDP), at a total of 16.9 Mta, compared to 17.2 Mta in 2019, which corresponds to a fall of 1.3 %. In the period between January and April 2021, waste paper utilization levels increased again by 5.1 % compared to the prior-year period to 5.95 Mta. The production of paper, card and cardboard for packaging purposes increased by 6.8 % to 4.38 Mta (Jan-Apr. 2021), while in the same period, the production of graphic papers fell by -7.5 % to 2.07 Mta and for hygiene papers by -4.8 % to 0.49 Mta. This corresponds to an overall production increase of 1.5 % to 7.44 Mta (Jan-Apr. 2021).
4 Plastic waste
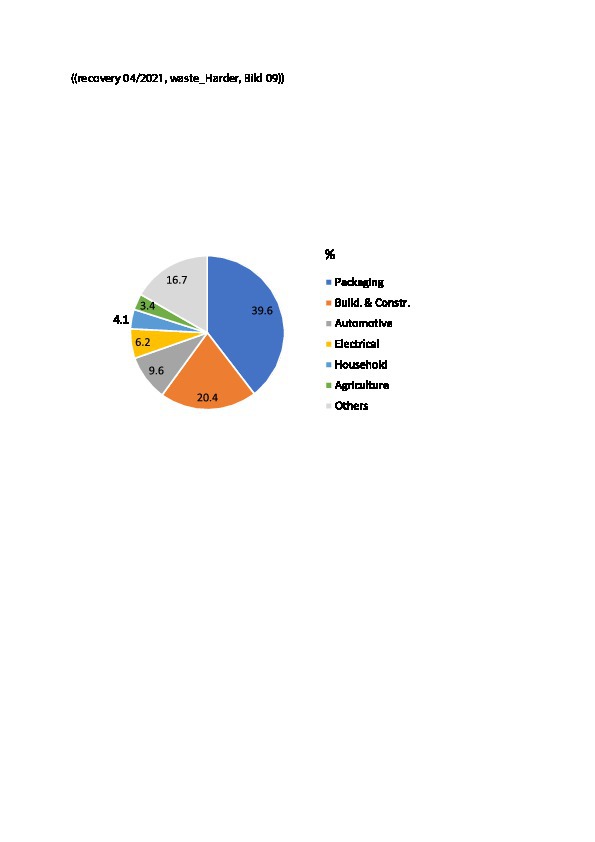
The COVID pandemic has accelerated the negative trend in European plastics production by -8.5 % in 2020. The German Association for Plastics Packaging and Films (IK) reported in May 2021 that the supply chains in the plastics processing industry have come under massive pressure since the beginning of 2021 on account of a shortage of raw materials and sharp price increases, The Association of Plastics Manufacturers, Plastics Europe, is expecting a tense supply situation for raw materials for the production of polyethylene (PE), polypropylene (PE) and monoethylene (MEG) up to the end of the year. In 2019, Europe held a global share of 16 % in plastics production, totalling 368 Mta, while China reached 31 % on its own. Demand for plastics in Europe stood at 50.7 Mta in 2019, Germany accounting for 24.2 %. Fig. 9 shows the demand in Europe by the key industries. The biggest share with 39.6 % is attributed to the packaging industry, followed by the building materials sector and automotive engineering.
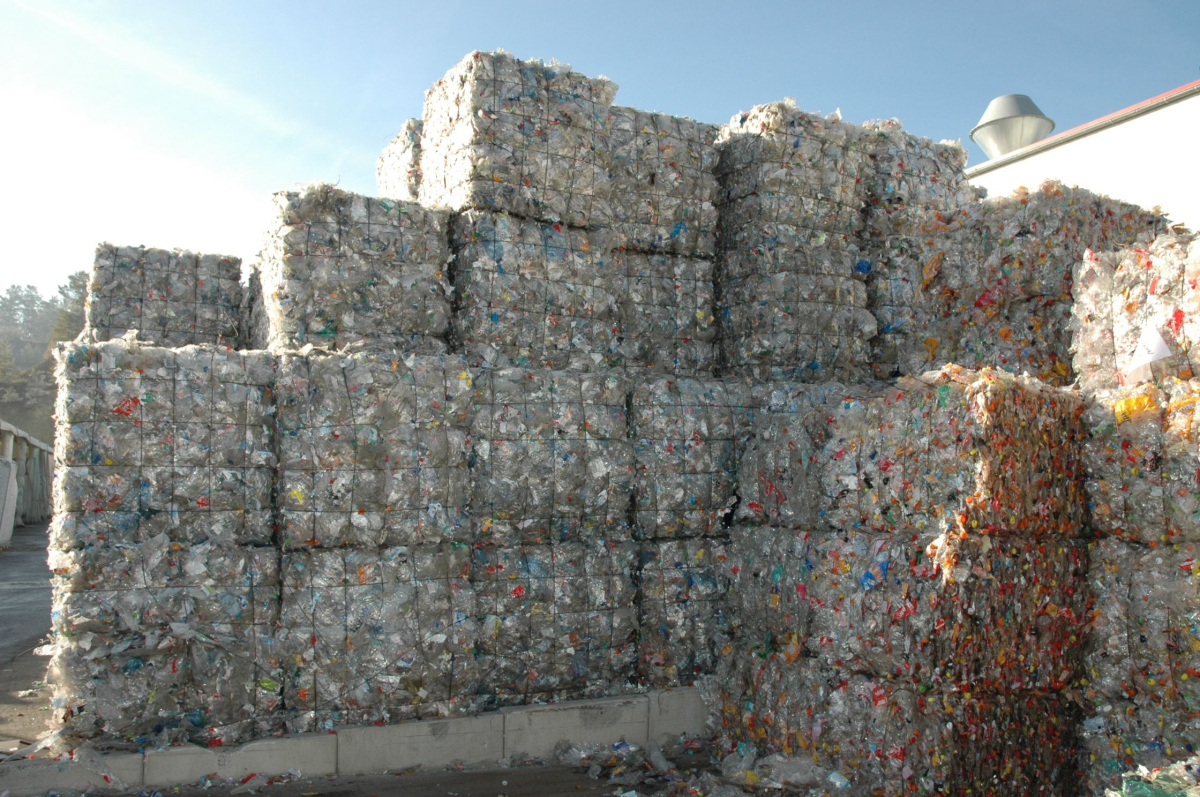
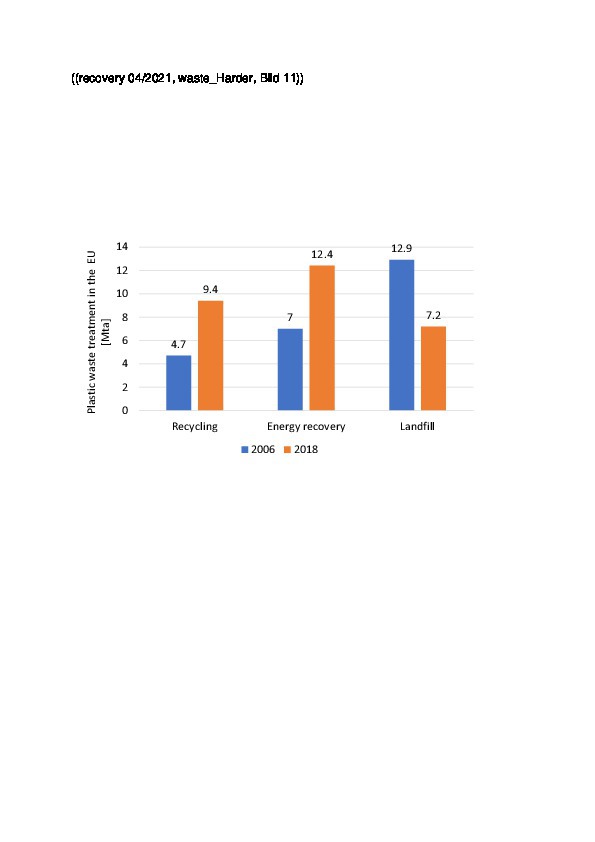
In 2018, a total of 29.1 Mta plastic waste was collected in Europe (EU27 + UK, NO, CH) (Fig. 10); that is almost 19 % more than in the reference year 2006. The share of recycled plastic has doubled from 4.7 Mta to 9.4 Mta and now stands at 32.5 % (Fig, 11). The main amount of 12.4 Mta (42.6 %) is sent to waste-to-energy installations, 7.2 Mta or 24.9 % of the plastic waste is still landfilled. For a total of 14.8 Mta plastic packaging waste, recycling has become the most important option. 42.0 % was recycled in 2018, 39.5 % was sent to incineration and 18.5 % to landfills. The recycling rates for plastic packaging waste range between 26 % and 52 % from country to country, averaging 42 %. Exports of plastic waste to countries outside the EU have decreased by 39 % since 2006 [2]. Since 2021, only exports of recyclate are allowed, to combat pollution of our seas [3].
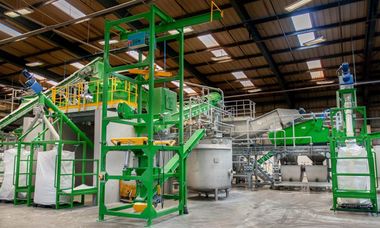
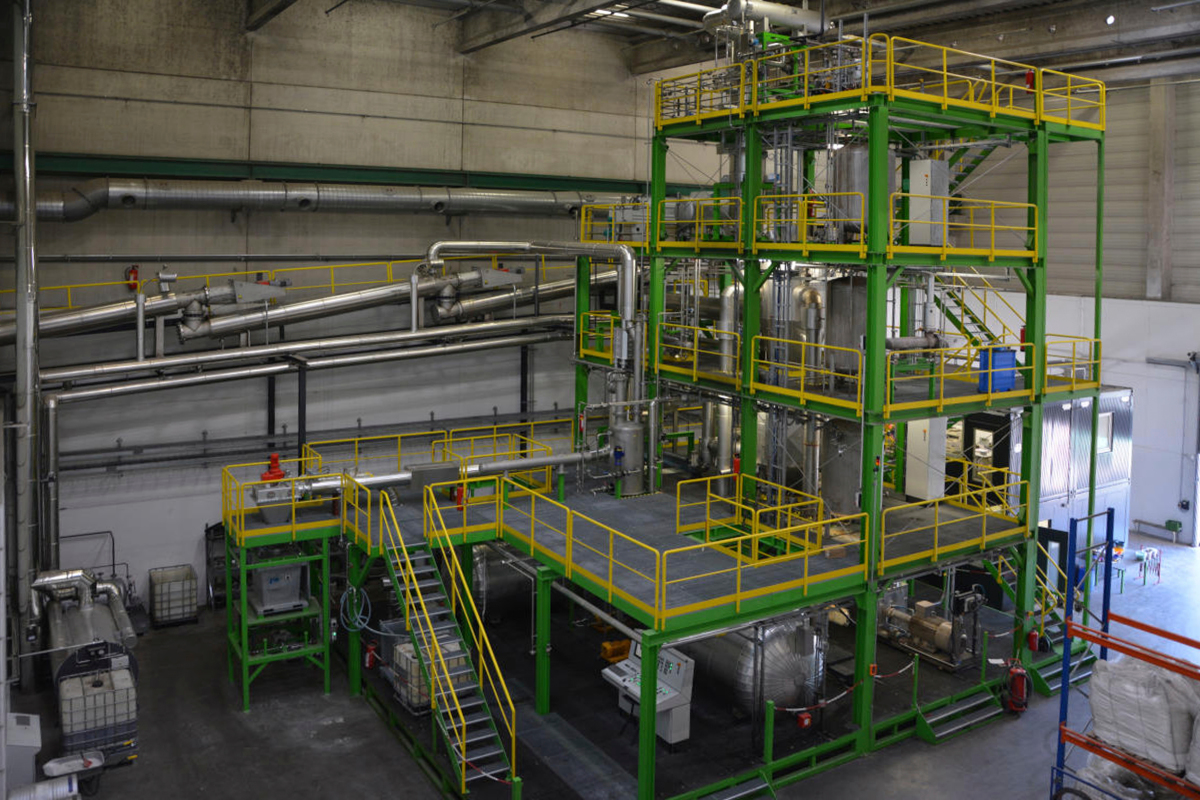
In 2018, in the EU, a total of around 5.0 Mta plastic waste was recycled. The plastic waste is mechanically and chemically processed and transformed into new plastic products, Around 4.0 Mta of the recyclate remained in Europe, 1.0 Mta was exported. Of the recyclate, 46 % was used for new construction products, 24 % for packaging material, 13 % for agricultural sheeting and 17 % for other plastic products for the household, automotive engineering, shoe industry, etc. In the light of the recently experienced shortages in raw materials, the industry has realized that there is much more potential in plastics recycling. In May 2021, Plastics Europe announced that the European plastics manufacturers want to invest € 2.6 bill. in chemical recycling plants by 2025 and € 7.2 bill. € by 2030. Fig. 12 shows a pilot plant operated by Carboliq in Ennigerloh, in Germany’s Münsterland region, where plastic film waste is converted into pyrolysis oil.
5 Old clothes and textiles
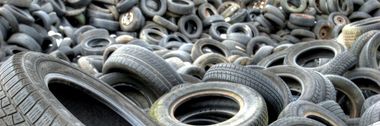
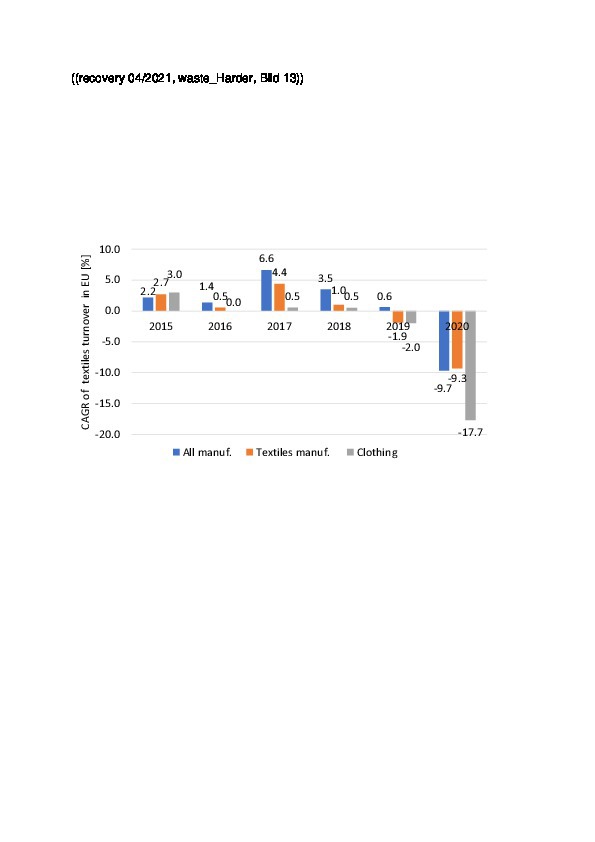
The sales of the European textiles industry slumped drastically in 2020 on account of the Corona pandemic, after a negative trend could already be identified in the years 2018 and 2019 (Fig. 13). The largest declines were in the clothing sector as retail broke down completely and online shopping brought only comparatively limited new impulses. In the middle of the year, when production slumped by almost 50 %, the crisis could be felt very severely. In the first quarter of 2021, sales increased slightly again by 3.8 %, but there is still no talk of a turnaround in the industry. On the contrary, according to Euratex, the European Apparel and Textiles Confederation, the crisis will continue in 2021 and possibly into 2022. Reasons for this are the fall in prices in the clothing industry and the price increases for raw materials, fabric dyeing and transportation.
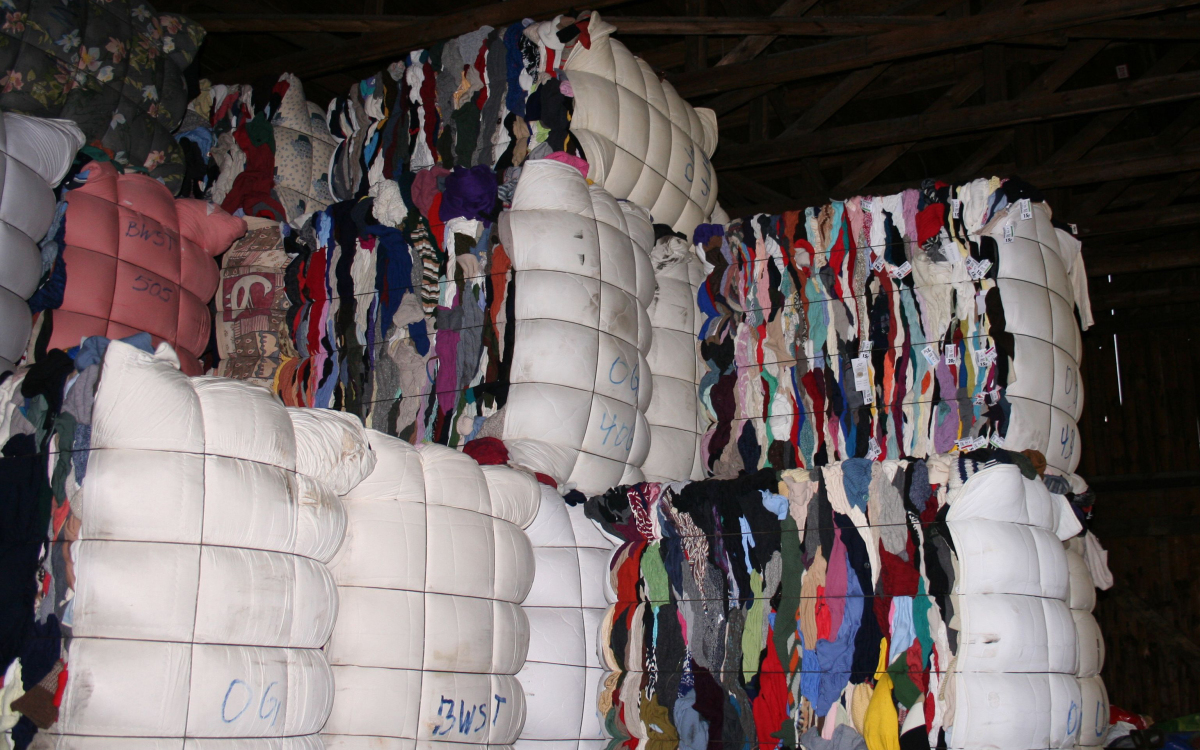
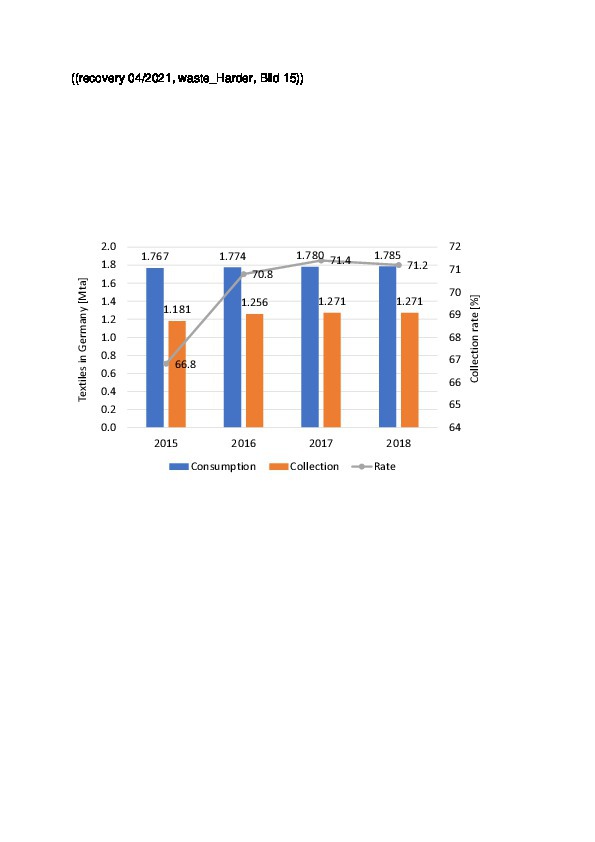
Recycling of textiles (Fig. 14) has so far only played a minor role in Europe and worldwide [4]. Unfortunately, for the European Union, no reliable data on the reuse and recycling of clothing and household textiles is available as yet. The separate collection of textiles is reported to have ranged between 1.6 and 2.5 Mta in the EU in 2020. At the moment, still less than 1 % of clothing is recycled to new material to make yarn for new clothing. For Germany, however, studies are available for different years for the demand, consumption and reuse of clothing and textiles from the German Federal Association of Secondary Resources and Waste Management (bvse) [5]. Fig. 15 shows the current consumption of clothing and home textiles as well as the collection levels and the associated collection rates. The collection level corresponds to 14.4 kg per capita in 2015 and 15.3 kg in 2018.
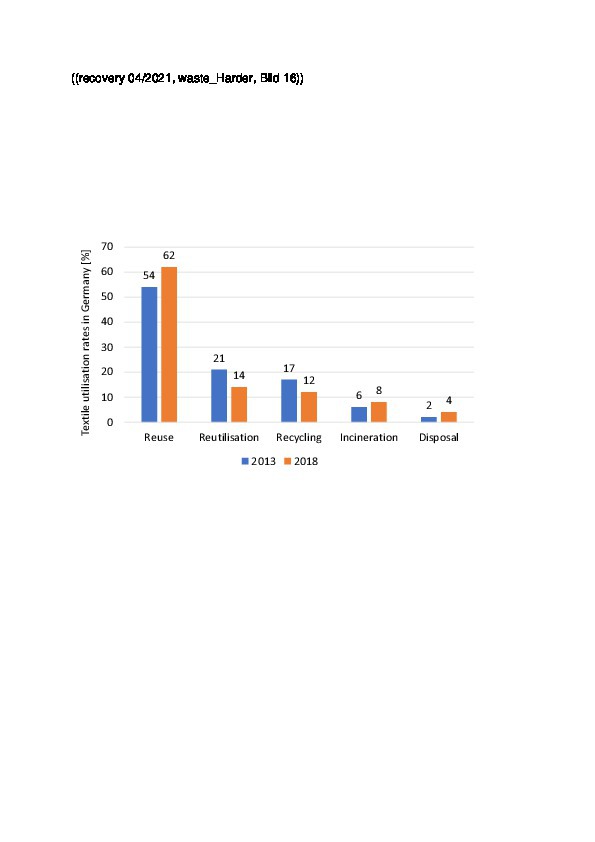
Fig. 16 shows the utilization options for the years 2013 and 2018 according to their percentages of the total quantity. It is evident that the reuse quota for clothing has increased slightly to 62 %. The lion’s share of these clothes is exported. The continued use of clothes for cleaning cloths and other used has, on the other hand, decreased to 14 %. With 12 % a much smaller percentage can be identified as being recycled to material or new fibres. This can be attributed to the fact that more and more mixed fabrics are used while the quality of the fibres is deteriorating. Accordingly, the quantities that are thermally disposed of or land at landfills have increased. In absolute figures, In Germany in 2018 only 157 000 t were reused as material – compared with 172 000 t in 2013. This trend is regarded as worrying by the recycling industry.
6 Spent batteries
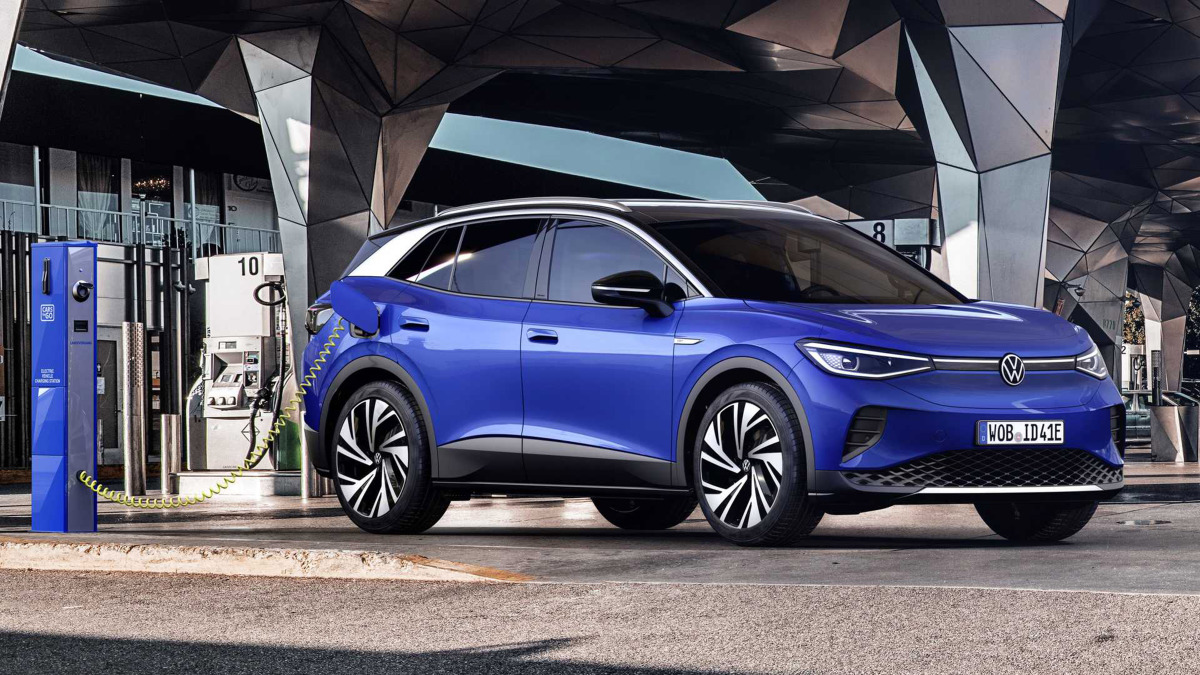
The market for electric-powered vehicles is booming. In April 2021 alone, 392 000 new electric cars were sold worldwide. In Europe, there were 71 500 exclusively battery-powered electric cars and 81 000 plug-in hybrids. In Germany alone, almost 26 800 solely electric-powered new cars were registered (Fig. 17), corresponding to an annual increase rate of 380 % and a market share of 11.6 % of new vehicle registrations. In a current EU strategy paper, the market forecast by the World Economic Forum have been adopted – this predicts global growth of battery capacity from 282 GWh in 2020 to 2623 GWh in 2030. Europe is set to contribute 29 % to the growth. To this end, the EU wants to revise the battery directive 2006/66/EC dating from the year 2006, and reintroduce it by 2022. This will lead to a revision of the battery laws in the member states.
Every year, in the EU around 800 000 t car batteries, 190 000 t industry batteries and almost 200 000 t portable batteries come onto the market. With the new battery directive, better provision is made for the recycling economy, sustainability improved and pace kept with technical progress. In the directive, the EU Commission stipulates binding requirements for all batteries (portable, industry and vehicle batteries) that are traded on the market in the EU. In future, batteries and rechargeable batteries will be deemed “portable” batteries if they are sealed, weigh lighter than 5 kg, are not designed for industrial purposes and classified neither as electric vehicles batteries nor as car batteries. For the first time, this definition will then include rechargeable batteries for E-bikes. To substantially improve the collection and recycling of portable batteries, the current binding collection quota will be increased from 45 % to 65 % in 2025 and to 70 % in 2030.
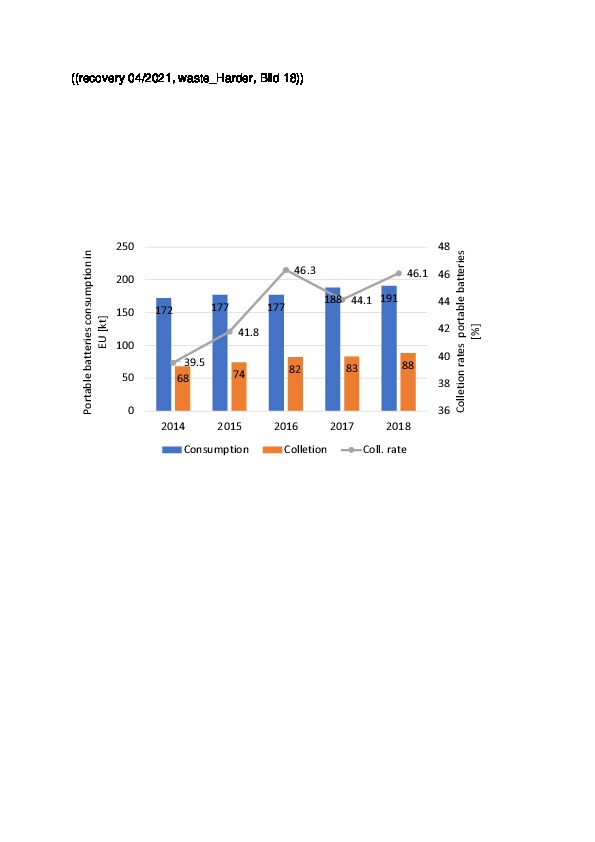
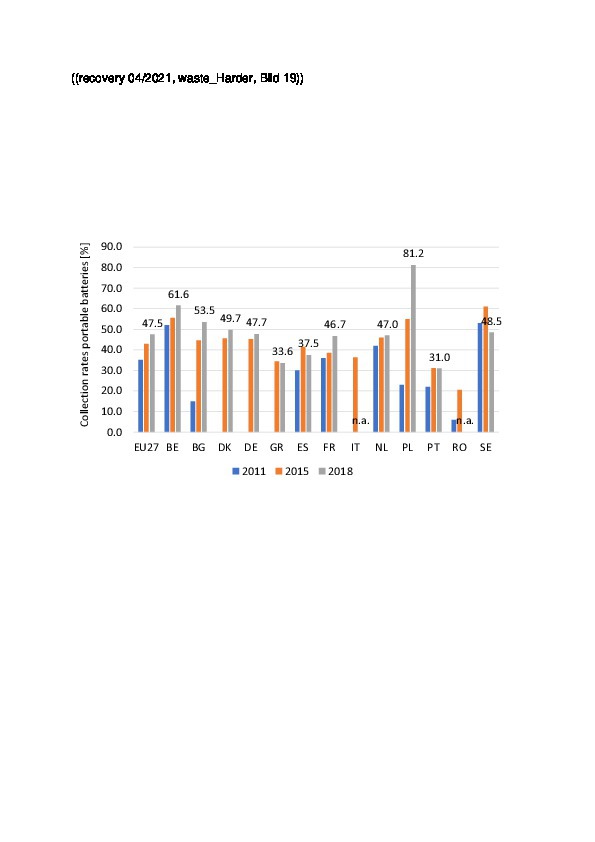
Fig. 18 shows the currently available consumption and collection levels for portable batteries in the EU27. While the consumption of portable batteries increased from 172 000 t in 2014 to 191 000 t in 2018, the collection level rose from 68 000 t to 88 000 t. The collection rate from these quantities has therefore increased from 39.5 % to 46.1 %, the specified collection quota of 45 % thus being met. Fig. 19 shows how the collection quota is distributed over the individual countries in the EU. However, for a conspicuously large number of countries, no values are reported. According to the latest figures available, the highest collection quotas were reached by Poland (81.2 %), Belgium (61.6 %) and Bulgaria (53.5 %). At the lower end of the rankings are the Southern European countries of Greece (33.6 %), Spain (37.5 %), Italy (36.1 % in 2017) and Portugal (31.0 %). Romania reached a collection quota of 49 % in 2017.
7 Outlook
The European Union is currently taking on the role of global pioneer in waste policy and the recycling economy. To this end, back in December 2015, a first package to promote the recycling economy was put forward, which comprised revised legislative proposals on waste management and a comprehensive action plan for the recycling economy with a concrete mandate for the term of office of the European Commission at that time. In 2018, a second set of measures was added to this package, which foresees, amongst other things, an EU-wide strategy for plastics in the recycling economy and a monitoring framework with indicators for the recycling economy. For this, public funding totalling in excess of € 10 bill. was made available for the period from 2016 to 2020:
€ 1.4 bill. € from the Horizon 2020 programme, including € 350 mill. for plastics recycling
€ 7.1 bill. from the cohesion policy (€ 1.8 bill. for the introduction of environmentally innovative technologies by SMEs and € 5.3 bill. € to support the implementation of the EU waste law)
€ 2.1 bill. with financing options like the European Fund for Strategic Investment
In addition, investments of at least € 100 mill. from the LIFE programme in over 80 projects that contribute to the recycling economy.
However, the data from Eurostat also show clearly that there are still large regional differences with a north-south divide when it comes to recycling efforts. Such deficits also become quickly evident if we examine the big differences between the countries when it comes to the number of recycling and waste treatment plants. In many countries, uncontrolled landfills ae still tolerated. Here, especially, it is necessary to remedy this situation soon and make sure such landfills are closed. In addition, the statistical data material from Eurostat lags behind the current developments by two to three years, which is by no means acceptable. It would be desirable for the elimination of these deficits to be included in the EU’s new action plan on the recycling economy.