Current global trends
 © Norsk Hydro
 © Worldsteel
 © Worldsteel
 © Worldsteel
 © BIR
© BIR
 © BIR
© BIR
 © ArcelorMittal
 © World Aluminium
 © Norsk Hydro
 © World Aluminium
 © World Aluminium
 © IAI
© IAI
 © EPA
© EPA
 © Norsk Hydro
 © Aurubis
 © ICSG
 © CMRA
 © Wood Mackenzie
 © Aurubis Group
Metal recycling extends the lifetime of resources and benefits the environment. At the same time, the recycling of metals is more cost-efficient than primary production. The following paper describes what importance the recycling of iron, aluminium and copper already has today and which countries and regions are leading on a global scale. It also discusses what the challenges are and how current and future development look. To this end, various leading companies are examined more closely.
1 Introduction
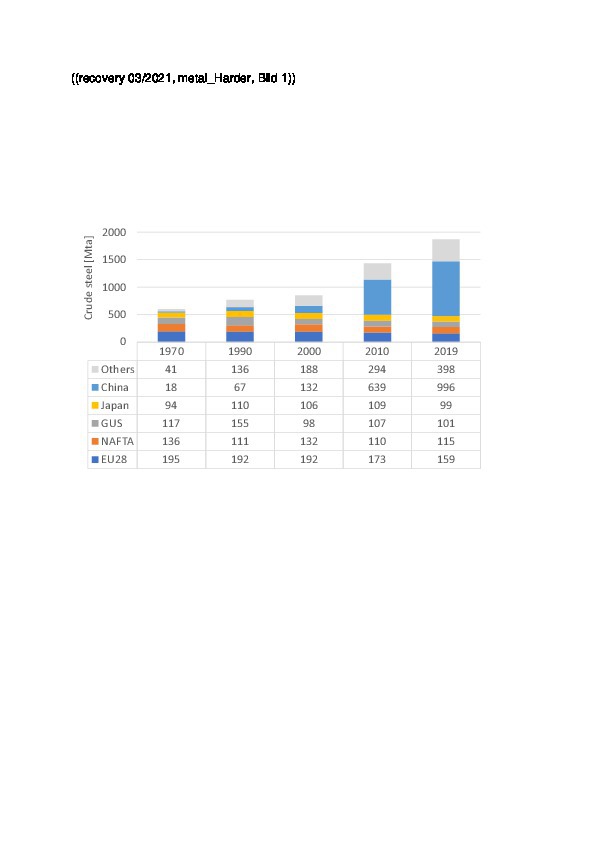
The global consumption of resources is alarming. Fig. 1 shows the worldwide production of crude steel over the last 50 years for major countries. Since 1970, production has increased by more than 3.1-fold from 601 million tonnes per year (Mta) in 1970 to 1869 Mta in the year 2019. China‘s share in crude steel production increased from 3.0 % to 53.3 % during that time, while the share of Europe (EU28) fell from 32.4 % to 8.5 %. The losers also include the NAFTA states (1970: 22.6 %, 2019: 6.2 %), the CIS states (19.4 % and 5.4 %, respectively) and Japan (15.7 % and 5.3 %, respectively). The share of other countries, which include India, Brazil, Turkey and others, grew from 6.9 % to 21.3 % in the same period of time.
According to the Bureau of International Recycling (BIR), around 630 Mta scrap iron were recycled worldwide in 2019, resulting in a total of 950 Mta of CO2 emissions being saved compared with corresponding crude steel production from iron ore [1]. Thanks to the significant energy savings of around 72 % because of the use of scrap iron instead of iron ore, a massive contribution is made to climate protection. The calculations assume that from the 630 Mta scrap iron, around 37 Mta (6 %) go into crude steel production in blast furnaces (BOF route), while the lion’s share of 523 Mta (83 %) goes into the EF steel process (EF route) and another share of around 70 Mta (11 %) goes to foundries. The recycling of scrap iron is regarded as a flagship example for closing material loops.
But metal recycling is not only about the steel industry. Besides steel, all metals can be used, recycled, remelted and reused any number of times. In metal recycling, a differentiation is made between ferrous (Fe-metals) and non-ferrous metals (NF). Fe metals contain iron as a main component. Non-ferrous metals do not contain any iron (Fe) and consist, for example, of aluminium, copper, lead, zinc, nickel, cobalt, chromium or special and precious metals. Another important step in metal recycling is therefore first a separation of scrap metals into Fe and NF metals. A number of processes is available for this, e.g. magnetic separation. Fe metals exhibit magnetic properties whereas NF metals don’t.
2 Scrap iron
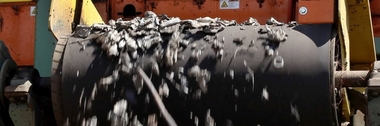
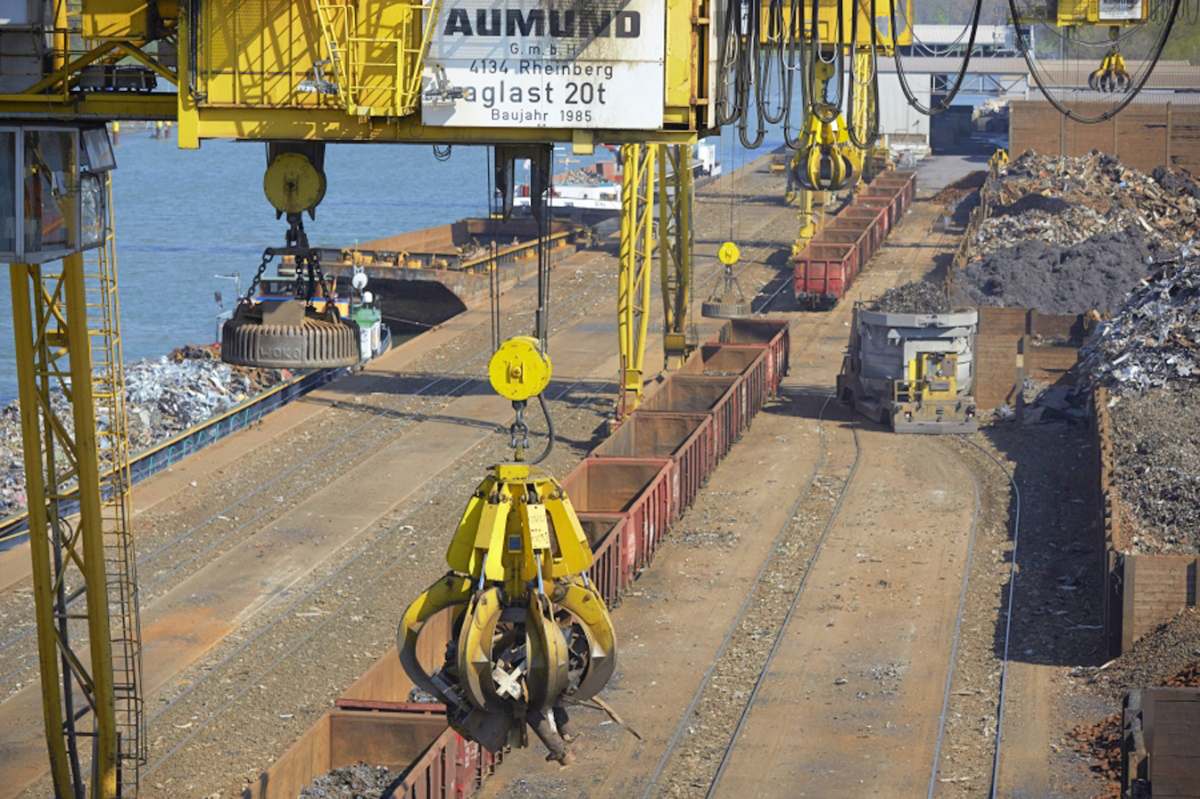
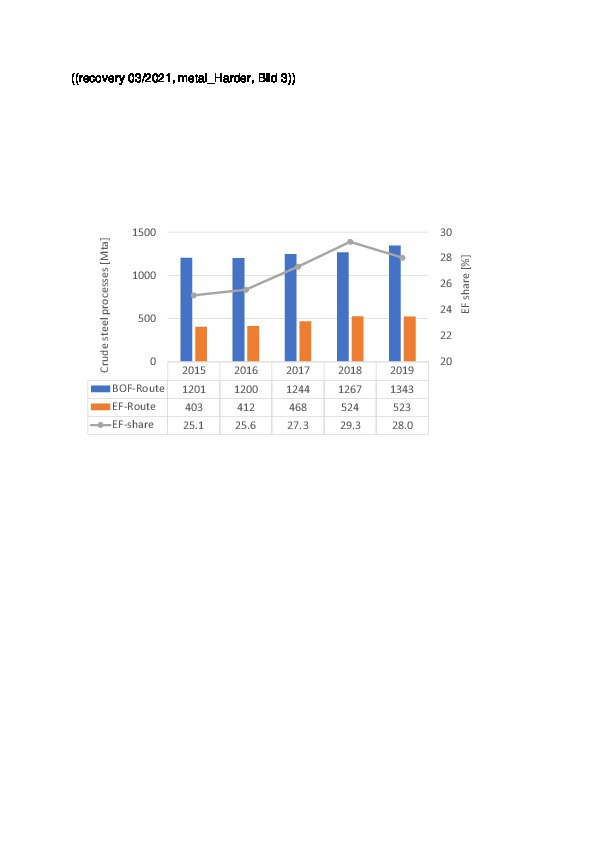
The recycling of scrap iron has a long tradition (Fig. 2). With the increasing global production of crude steel, over the years the recycling rates and the capacities for electric furnace steel (EF) processes have grown. Scrap iron is melted directly there. We can see that crude steel production from the blast furnace process (BOF) as well as from the EF process has increased in recent years (Fig. 3). The share of the EF processes has increased from 25.1 % in 2015 to 29.3 % in 2018. In 2019, the EF percentage fell. This is associated primarily with the high growth in crude steel production in China, which shows with around 21 % a much lower EF share and therefore smaller percentage of scrap iron in the production of crude steel compared to the world averages.
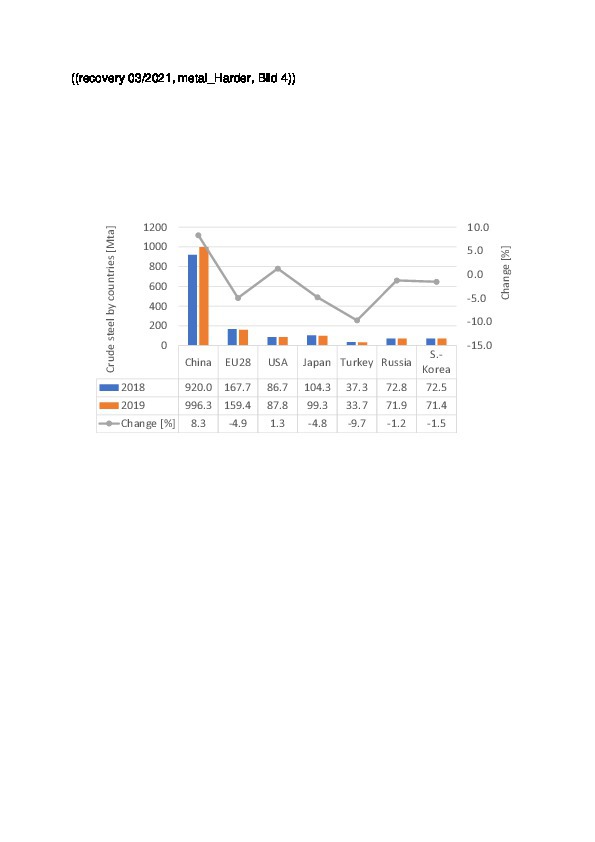
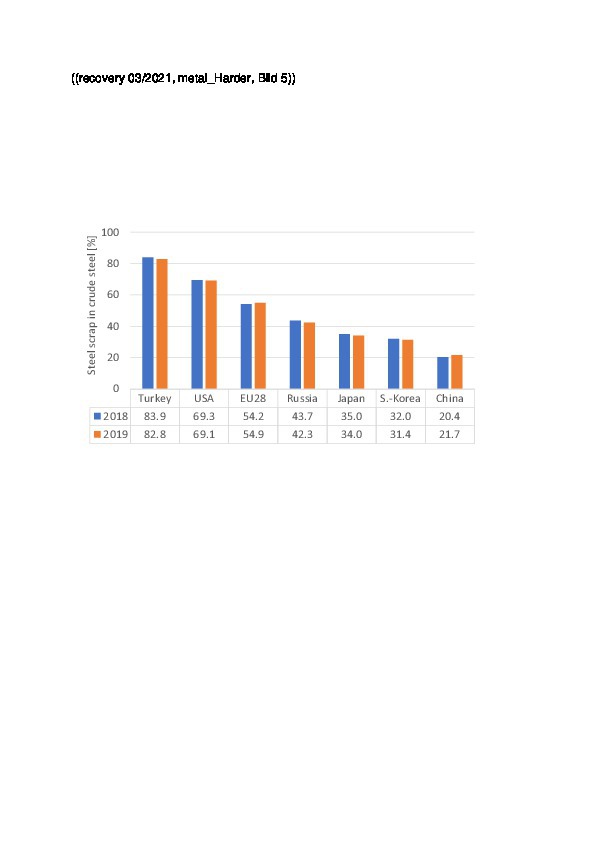
Fig. 4 shows the crude steel production of major production countries for the years 2018 and 2019 with the changes in percent [2]. China was able to increase its crude steel production by 8.3 % to a global share of 53.3 % compared to 51.4 % in 2018. EU28 production fell by -4.9 % to a global share of 8.5 % compared to 9.4 % in 2018. The USA was able to increase its production slightly by 1.4 % to a global share of 4.7 %, has, however, lost 0.1 % points in its global share. Fig. 5 shows how the share of scrap iron in crude steel production has changed for these countries from 2018 to 2019. EU28 lies with a scrap iron share of around 55 % in the midfield. Nevertheless, this share could be increased from 54.2 % to 54.9 % in 2019. Turkey and the USA have the highest shares, while Japan, South Korea and China report the lowest shares.
In recent years, international trade with scrap iron has stayed on an almost constant level at 90 to 110 Mta. In 2019, the level was 100 Mta. The most important export countries (data from 2019) are the EU28 countries with 21.8 Mta, followed by the USA (17.7 Mta), Japan (7.7 Mta), Canada (4.4 Mta), Russia (4.1 Mta) and Australia (2.3 Mta). The major import countries are Turkey with 18.9 Mta, followed by India (7.1 Mta), South Korea (6.5 Mta), the USA (4.3 Mta), Pakistan (4.3 Mta), Taiwan (3.5 Mta) and EU28 (2.9 Mta). Interesting are also the high percentages of scrap iron in foundry production. According to the latest figures from the BIR for 2018, of the global foundry production at 90.0 Mta, scrap iron accounts for 82.6 % or 74.4 Mta. A share of 61.9 % of this scrap was bought in from external sources.
Around 84 % of the steel ever produced globally is still in use thanks to its durability and perpetual recycling. 1 t scrap steel (carbon steel) saves an average of 1.67 t CO2, 1 t scrap stainless steel saves as much as 4.3 t CO2. Recycling, however, also has its limits, and to secure further CO2 savings in steel production, other measures are necessary. The steel industry is on the verge of transformation, i.e. a switch of production to low-CO2 and zero-CO2 processes. In climate-neutral steel production, for every tonne of climate-neutral hydrogen used, 26 t CO2 emissions can be saved. But that is still a long way ahead, and the decision and technology investments necessary for this must still be made.
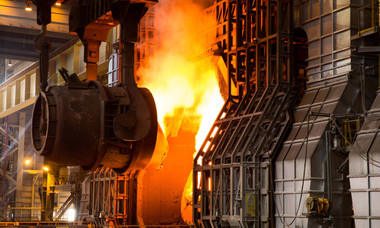
ArcelorMittal, the leading company in the steel industry, produced a total quantity of 89.8 Mta crude steel in 2019. For this, 26.2 Mta scrap iron and 115 Mta iron ore were used. Europe accounted for a crude steel quantity of 42.35 Mta (47 % of ArcelorMittal’s output). By 2030, the aim is to save 30 % CO2 emissions in Europe, with the plan to produce in a CO2 climate-neutral process by 2050. For this, a host of new developments has been introduced. In Ghent in Belgium, probably the most modern blast furnace in the world has gone into operation (Fig. 6). There in a demonstration plant, the blast furnace flue gases are to be converted into bioethanol. ArcelorMittal is the first steel manufacturer to offer “green steel” based on a certification system of CO2-savings since back in late 2020.
3 Scrap aluminium
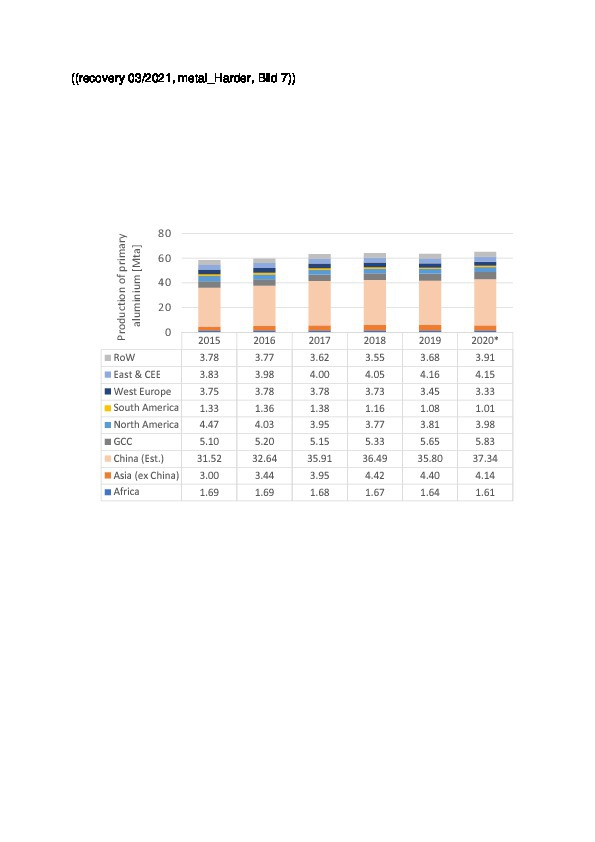
Over the last ten years, the global primary aluminium industry has radically changed – especially because China was able to increase its market share to around 57 % of the global smelting capacity by the end of 2020. Fig. 7 shows the development of primary aluminium production by regions. Primary aluminium is produced from alumina by means of smelting flux electrolysis. Global production has increased from 58.5 Mta in 2015 to 65.3 Mta according to the provisional figures for 2020. With 5.8 Mta in 2020 or 8.9 %, the Gulf States (GCC) reaches the second largest share behind China. Western Europe’s share is only 5.1 %, because primary production has fallen from 3.75 Mta aluminium to 3.33 Mta. In North America, production has decreased from 4.47 Mta to 3.98 Mta.
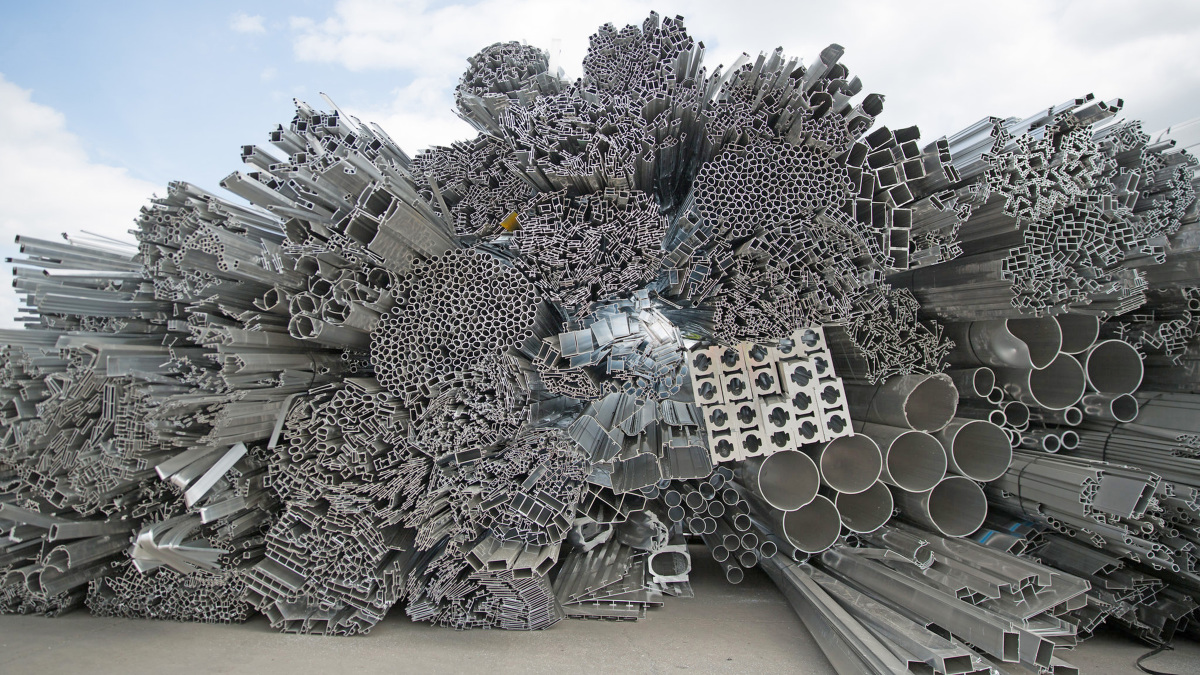
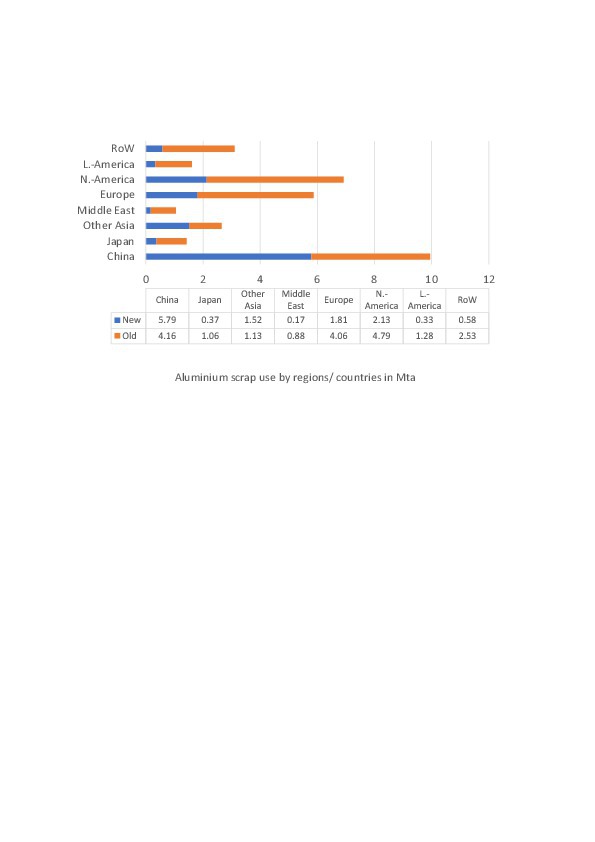
Interesting is a comparison of the figures for the secondary production of aluminium to those for the primary production. Secondary aluminium is produced by remelting scrap aluminium, which consists of new scrap from aluminium production or old scrap from the recycling of used aluminium (Fig. 8). The figures for this vary widely in some cases depending on their source. Here the figures from the International Aluminium Institute (IAI) and from World Aluminium are used (Fig. 9). According to the latest figures from 2018, a total of 32.6 Mta scrap aluminium were utilized, 12.7 Mta of which was new scrap and 19.9 Mta old scrap. In this context, North America and Europe reach high global shares of 21 % and 18 %, respectively, for the scrap aluminium used.
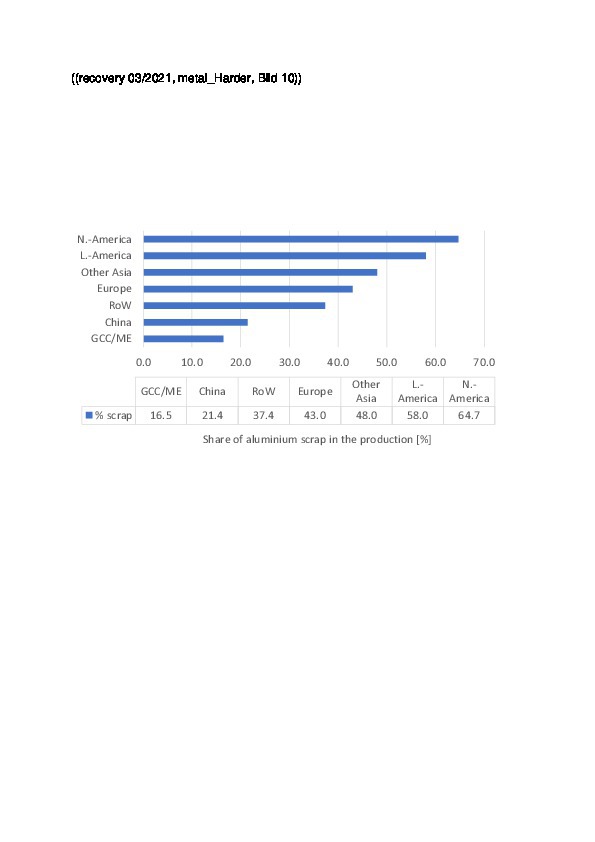
The scrap aluminium share results from the ratio of primary and secondary production (Fig. 10). In the market figures for 2018, America clearly leads with regard to the share of scrap. In North America, the percentage is 65 %, in Latin America 58 %, i.e. much more aluminium is produced in secondary than in primary production there. In Europe, the share of secondary production is only around 43 %, while it is only 21.4 % in China, and below 17% in the Middle East or the Gulf states. Worldwide, there results a percentage of scrap aluminium of 34 % in aluminium production. These figures, however, give no indication of what quantities of scrap aluminium were collected in these regions.
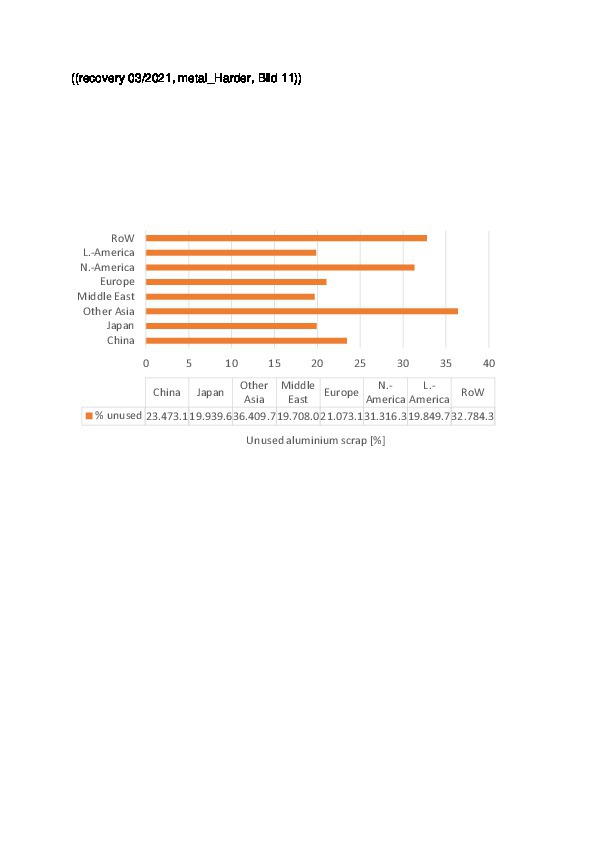
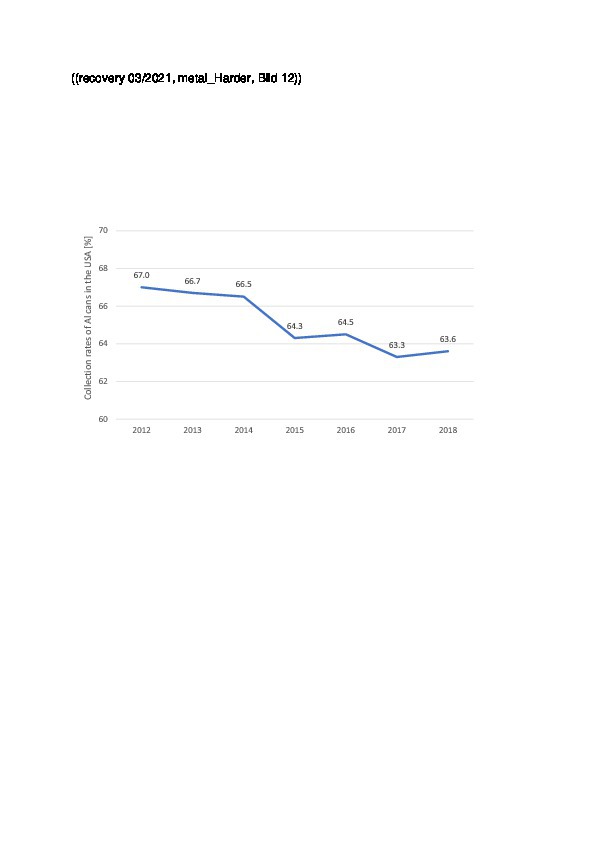
Fig. 11 provides information on the used scrap that has not been collected or unused old scrap. According to IAI, in 2018, from a total of 27.1 Mta of old scrap, 19.9 Mta was recycled as secondary aluminium, 7.2 Mta was unused and sent to landfills or waste incineration. Latin America and Japan have the lowest shares of unused old scrap with just under 20 %, while Europe reaches 21 % and China 23.5 %. North America, with 31 %, is one of the regions with the highest percentage of unused old scrap. This becomes clear from the collection rates for aluminium drinks cans in the USA (Fig. 12). As one can see, the collection rates for aluminium cans have steadily decreased in recent years in the USA and now lie at below 65 %.
Primary production of aluminium is around ten times more energy-intensive than secondary production. For this reason, in many countries, high expectations of further savings are associated with this. In the EU, the aim is to reach full recycling by 2030. For car components and construction products like windows and doors, a collection rate of 90 % has already been achieved, for drink cans it is 75 %. Estimates expect that old scrap aluminium in the EU will increase from 3.6 Mta in 2019 to 6.6 Mta in 2030 and 8.6 Mta in 2050. By 2050, 50 % of the aluminium demand is to be covered by old scrap. Aluminium recycling is set to reduce CO2 emissions by 39 Mta by 2050, which means another reduction of the CO2 emissions from aluminium production by 46 % compared to today.
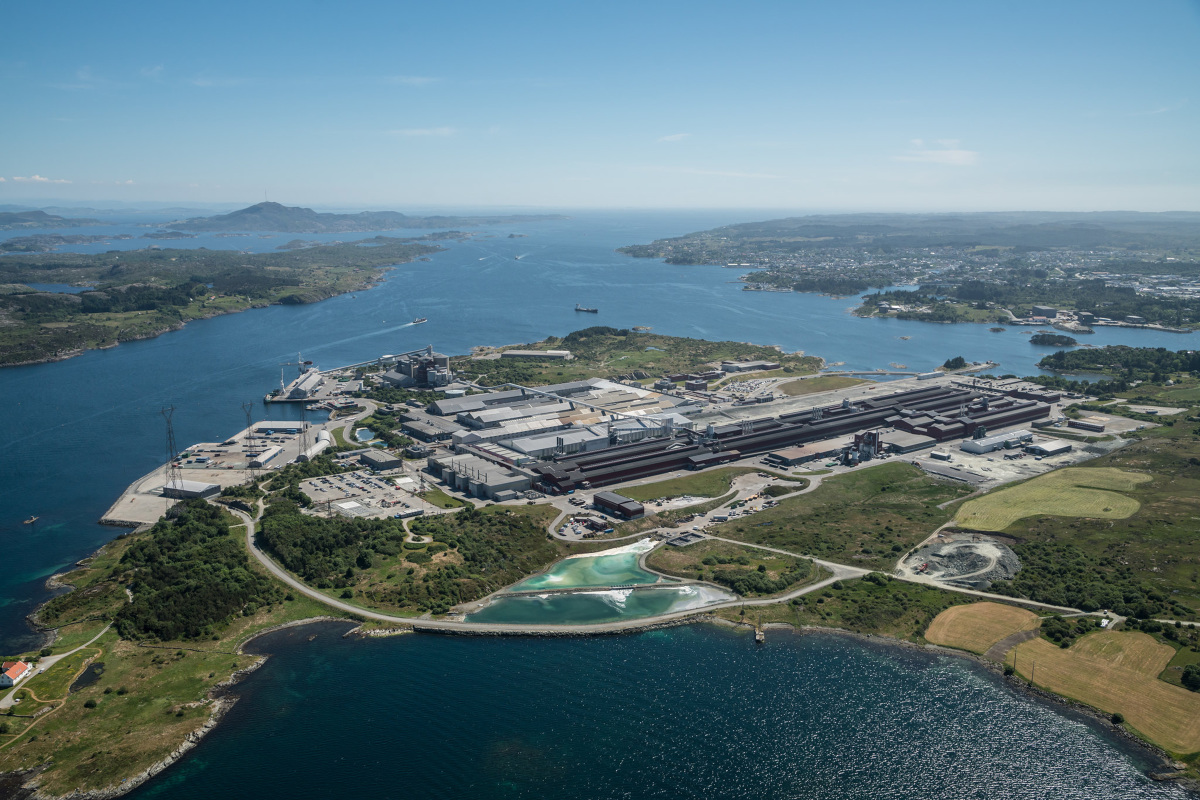
Norsk Hydro, Europe’s leading aluminium producer with a production output of 2.09 Mta in 2020, has a capacity for old and new scrap aluminium totalling 2.6 Mta. In 2020 around 1.25 Mta scrap aluminium was recycled, including around 85 % new scrap from the company’s own production operations as well as from other companies. For the market, two green products are offered. For the REDUXA product, which is produced in the Karmoy plant (Fig. 3), only hydropower is used, with CO2 emissions of just 4 t CO2/t primary aluminium. For the CIR-CAL75 product, at least 75 % recycled aluminium from old scrap is contained in the finished product. Norsk Hydro wants to increase the quantities of recycled old scrap from 0.09 Mta to 0.6 Mta by 2025.
4 Scrap copper
According to the International Copper Association (ICA) and models compiled by the Fraunhofer ISI-Society, of the quantities of copper launched on the market worldwide since 1900, 450 mill. t copper were still in use in 2018. 70 % of these are accounted for by products in energy, electrical engineering and communications technology. In 2018, a total of around 12.9 Mta copper were disposed of (Fig. 14). This compares with 29.3 Mta new copper from copper smelting. 8.53 Mta scrap copper was used in copper smelting, 3.99 Mta of which was recycled copper and 4.54 Mta scrap copper from the production of new copper, which is directly remelted. On the basis of these data, for copper production in 2018, a Recycling-Input-Rate (RIR) of just 29.0 % and an End-of-Life (EOL) recycling rate of 30.9 % can be derived.
For 2019, according to surveys of the International Copper Study Group (ICSG), the share of scrap copper from the production of new copper that was fed direct to smelting reached 5.2 Mta. The copper share of the recycled (EOL) scrap copper was 3.3 Mta. This quantity was fed direct the refining process. Accordingly, in 2019, a total of around 8.5 Mta scrap copper was utilized. With a quantity of 24.5 Mta from the copper refinery, the Recycling-Input-Rate in 2019 would lie at 28.6 %, In comparison, the RIR value in 2006 was still 36 %. This means that the recycling rates have decreased considerably in recent years, although the associations stress that recycled copper saves up to 85 % energy compared to primary production. According to the first figures from the ICSG, the recycling rates in 2020 continued to decline on account of the pandemic.
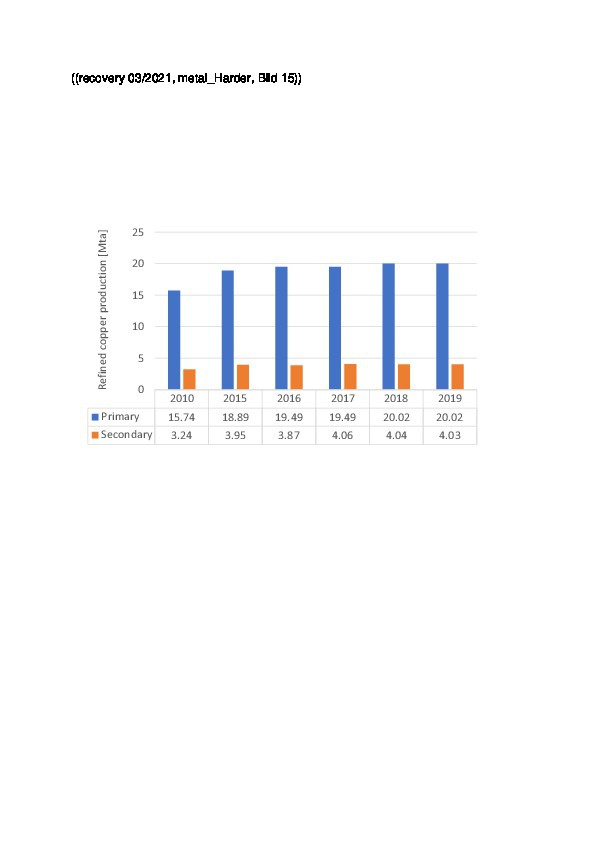
These figures are reflected to an extent in the figures of the worldwide production of refined copper. Fig. 15 shows the worldwide figures for primary and secondary production since 2016. According to the definition, secondary production contains scrap copper while primary production is based on copper concentrate from mining. In practice, there is some overlap as various products such as blister, black and anode copper cannot be directly classified as one or the other. Over the last ten years, copper primary production has increased from 15.7 Mta to 20.0 Mta, while secondary production has risen from 3.2 Mta to 4.0 Mta. The ratio of the two production quantities has remained roughly constant with a secondary copper share of around 17 % and a slight downward trend.
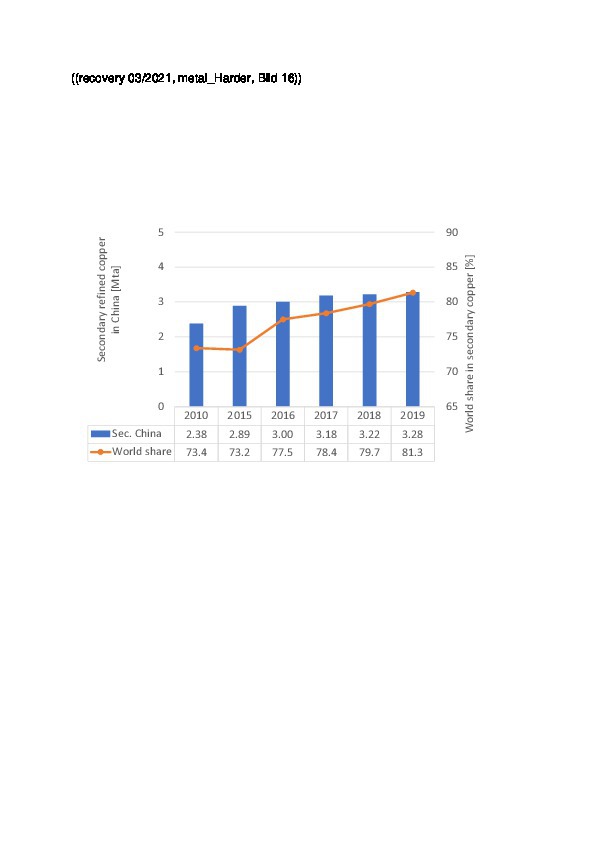
It becomes interesting if we look at secondary copper production in China for the same period of time (Fig. 16). This increased in the period from 2010 to 2019 from 2.4 Mta to 3.3 Mta [3]. Secondary copper therefore made up 34 % of the refinery production in China in 2019. As shown in Fig. 15, China’s share in the global secondary production has increased from 73.4 % to 81.3 %. In 2019, 2.2 Mta copper was recycled in China itself, 1,49 Mta were imported, of which 1.1 Mta was utilized. For 2020, an increase in the recycling quantities by 1.5 % has been forecast. By 2025, the aim is to recycle a quantity of 4.35 Mta scrap copper in China, including 3.0 Mta from quantities in China and 1.35 Mta from imported scrap.
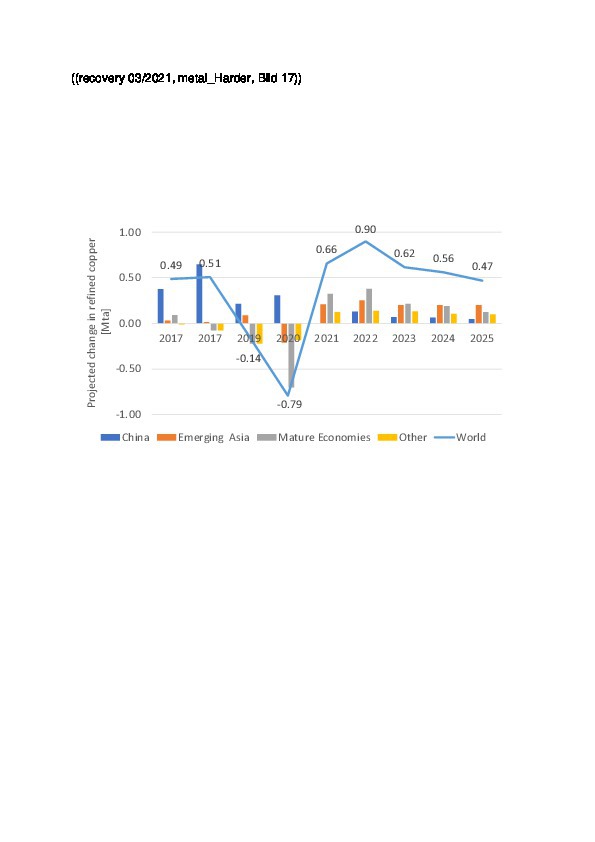
Fig, 17 shows how the consumption of refined copper will change by 2025 in the most important world regions. In the forecast by Wood Mackenzie, it is predicted that after a collapse in the worldwide consumption of around 0.79 Mta in 2020, a recovery of around +0.66 Mta will follow in 2021. In 2022, consumption will increase by 0.9 Mta, by 2025 the increase in consumption will cool down again slightly. The saturated markets in Europe, America and Asia showed the greatest losses in 2020, but also the greatest increases again afterwards. The reason for the high increases in copper consumption in the saturated market is suggested to be the high growth in copper consumption for green energy technologies (wind and solar energy) as well as the increases in electric mobility.
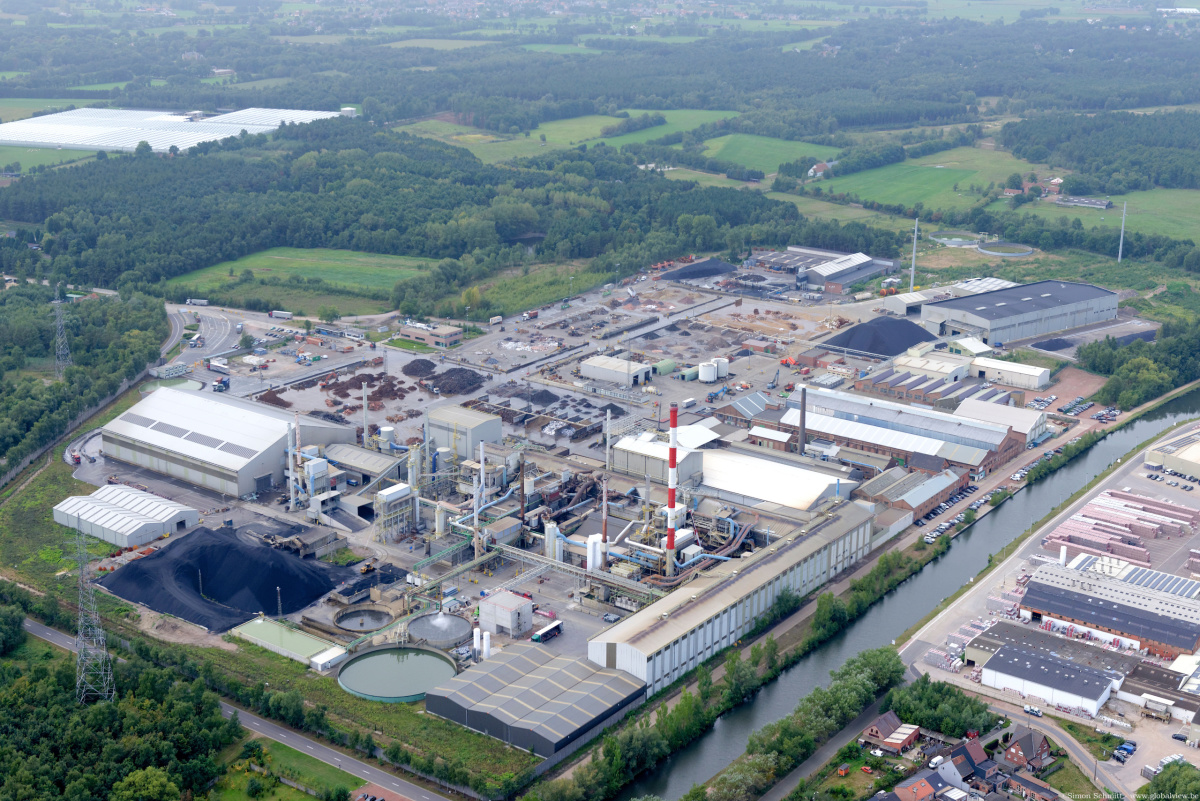
The Aurubis Group in Hamburg is regarded as the leading supplier and recycler of copper and other non-ferrous metals worldwide. In 2020, the company took over the Metallo Groupo Holding in Belgium (Fig. 18) and could therefore extend its production network of smelting works in Hamburg and Lünen in Germany, Pirdop in Bulgaria as well as Beerse and Olen in Belgium with the recycling of tin, lead, nickel and zinc in addition to copper. In the business year 2019/20, a copper concentrate throughput of 2.38 Mta was generated in the group, following 2.23 Mta in the business year 2018/19 and 2.52 Mta in the business year 2017/18. The quantities of processed scrap copper and blister are on a slight decline and totalled 0.37 Mta in 2019/20, down from 0.44 Mta in the business year 2018/19 and 0.41 Mta in the business year 2017/18.
5 Market prospects
Some of the figures for the recycling of metals are sobering. For this, it is enough to look at the current situation for aluminium and copper. We are a still a long way from a recycling economy. In future, the quantities of metal to be disposed of are set to increase considerably. Estimates assume that, for example, waste electrical and electronic equipment (WEEE) will increase from around 50 Mta at present to around 120 Mta by 2050. At present, in Europe with 12.3 Mta, the second highest quantities of this scrap were sent to Asia for disposal, with 18.2 Mta each year. If this scrap were completely recycled, it would be possible to recover around 0.33 Mta copper and 31 t gold from it. Yet, according to EUROSTAT, the collection rate in the different EU countries ranged for the most part only between 40 and 60 % in 2017.